Weekly Chart :

 CVM Finished the Major Down Trend on April 2019, and from then is in a solid Secondary Up Trend.
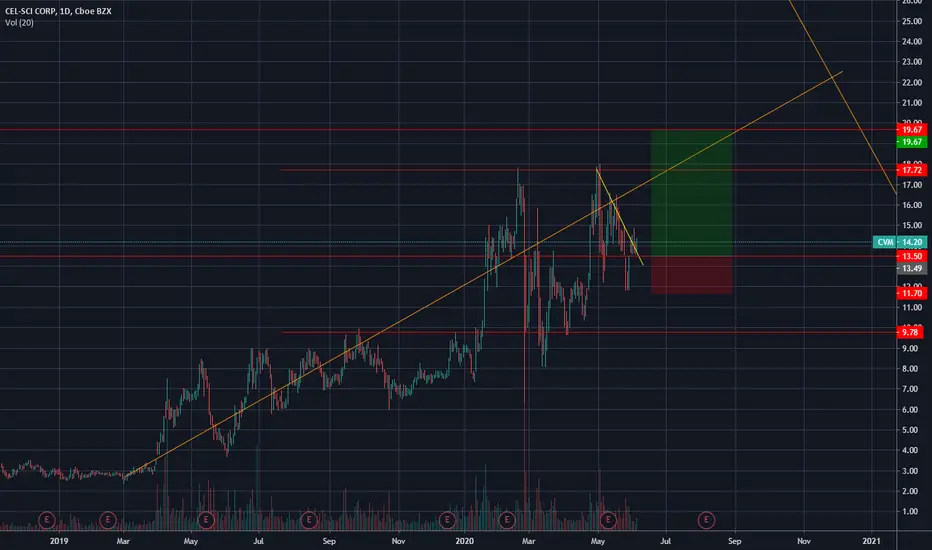
Note 13.50 Historical level, which serve us as a good support to form a trade.
Daily Chart :

Minor Down Trend about to end (Yellow):

Line Chart :

The Trade Plan :

Wait for a Clear Bullish Minor sign -
1. Strong buying Candle on 13.50 Level .
2. Retest of the Orange Trendline and closing above the Yellow Trendline.
CVM Finished the Major Down Trend on April 2019, and from then is in a solid Secondary Up Trend.Note 13.50 Historical level, which serve us as a good support to form a trade.
Daily Chart :
Minor Down Trend about to end (Yellow):
Line Chart :
The Trade Plan :
Wait for a Clear Bullish Minor sign -
1. Strong buying Candle on 13.50 Level .
2. Retest of the Orange Trendline and closing above the Yellow Trendline.

免責事項
これらの情報および投稿は、TradingViewが提供または承認する金融、投資、取引、またはその他の種類の助言もしくは推奨であることを意図したものではなく、またこれらに該当するものでもありません。詳細は利用規約をご覧ください。
免責事項
これらの情報および投稿は、TradingViewが提供または承認する金融、投資、取引、またはその他の種類の助言もしくは推奨であることを意図したものではなく、またこれらに該当するものでもありません。詳細は利用規約をご覧ください。