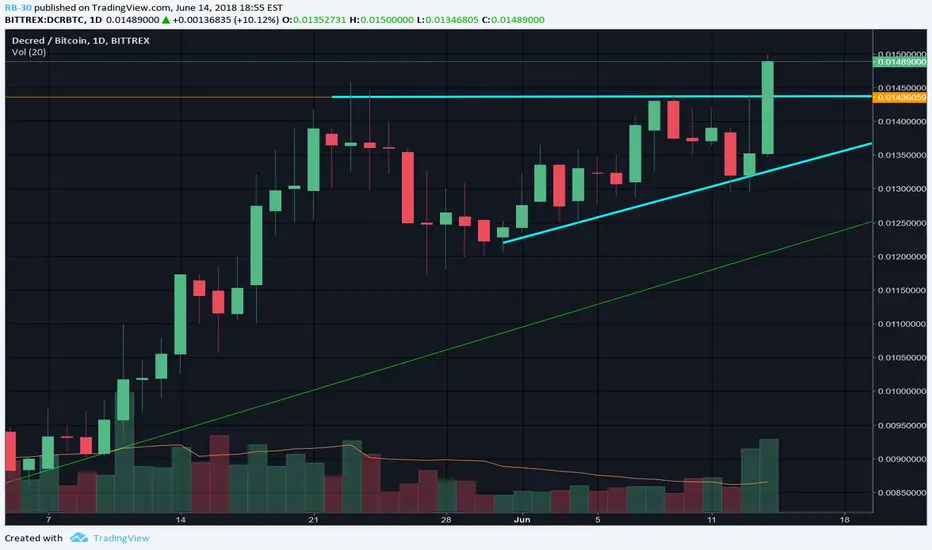
If you look at every daily chart, you will see that almost every coin has a bullish pattern sign. This doesn’t really imply that the downtrend is over or that there will be an uptrend. We only know that the bulls are declining the downward trend.
So Decred has been making an amazing uptrend, despite that almost every coin went down. The bears tried to push the price down by two times, but meanwhile you see that the bulls are squeezing the bears into the corner. This will lead to a continuation pattern, which is the ascending triangle.
The setup for this trade will be:
- The stop loss will be the support line of 0.01436059
- Target could be 0.01771530, but anything can happen on this way, that’s why I am going to update this chart until I am taking out my position.
ALWAYS keep in mind! That this is NOT an investment advice, but an analysis . You can do whatever you want with this information, so trade at your own risks!
So Decred has been making an amazing uptrend, despite that almost every coin went down. The bears tried to push the price down by two times, but meanwhile you see that the bulls are squeezing the bears into the corner. This will lead to a continuation pattern, which is the ascending triangle.
The setup for this trade will be:
- The stop loss will be the support line of 0.01436059
- Target could be 0.01771530, but anything can happen on this way, that’s why I am going to update this chart until I am taking out my position.
ALWAYS keep in mind! That this is NOT an investment advice, but an analysis . You can do whatever you want with this information, so trade at your own risks!
トレード終了: ストップロスに到達
Yesterday the red candlestick already closes below the support line
免責事項
これらの情報および投稿は、TradingViewが提供または承認する金融、投資、取引、またはその他の種類の助言もしくは推奨であることを意図したものではなく、またこれらに該当するものでもありません。詳細は利用規約をご覧ください。
免責事項
これらの情報および投稿は、TradingViewが提供または承認する金融、投資、取引、またはその他の種類の助言もしくは推奨であることを意図したものではなく、またこれらに該当するものでもありません。詳細は利用規約をご覧ください。