Hey everybody,
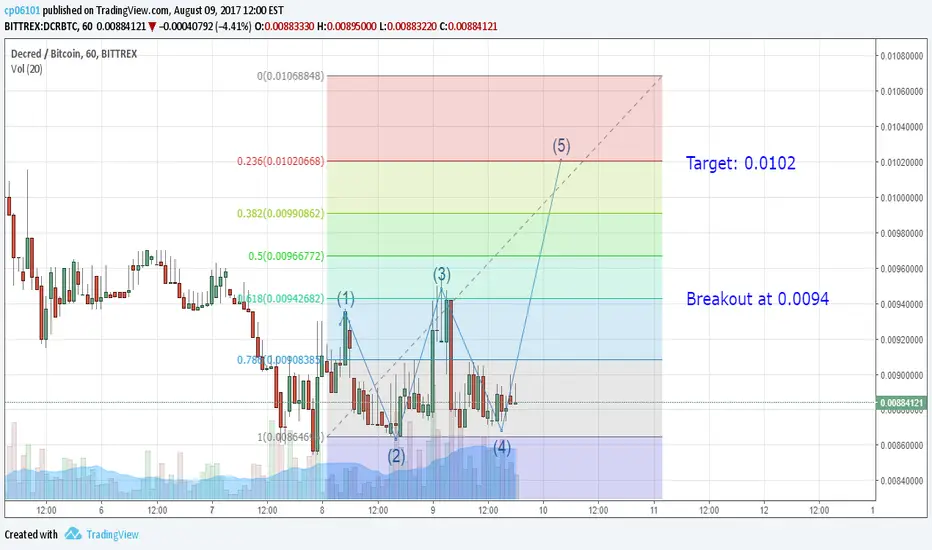
On this chart you can see the formation of a double bottom. If it breaks the 0.094 after that there will be the breakout.
You can see on the first part of this double bottom the volume was low and on second part it's increase, that's another sign it can moon.
Also you can see on the MACD the reversal is on it's way...
Please let me know what you think
Thank you,
Cryptoz
On this chart you can see the formation of a double bottom. If it breaks the 0.094 after that there will be the breakout.
You can see on the first part of this double bottom the volume was low and on second part it's increase, that's another sign it can moon.
Also you can see on the MACD the reversal is on it's way...
Please let me know what you think
Thank you,
Cryptoz

免責事項
これらの情報および投稿は、TradingViewが提供または承認する金融、投資、取引、またはその他の種類の助言もしくは推奨であることを意図したものではなく、またこれらに該当するものでもありません。詳細は利用規約をご覧ください。
免責事項
これらの情報および投稿は、TradingViewが提供または承認する金融、投資、取引、またはその他の種類の助言もしくは推奨であることを意図したものではなく、またこれらに該当するものでもありません。詳細は利用規約をご覧ください。