ロング
Long term health of DEFI in a critical moment - Triangle version
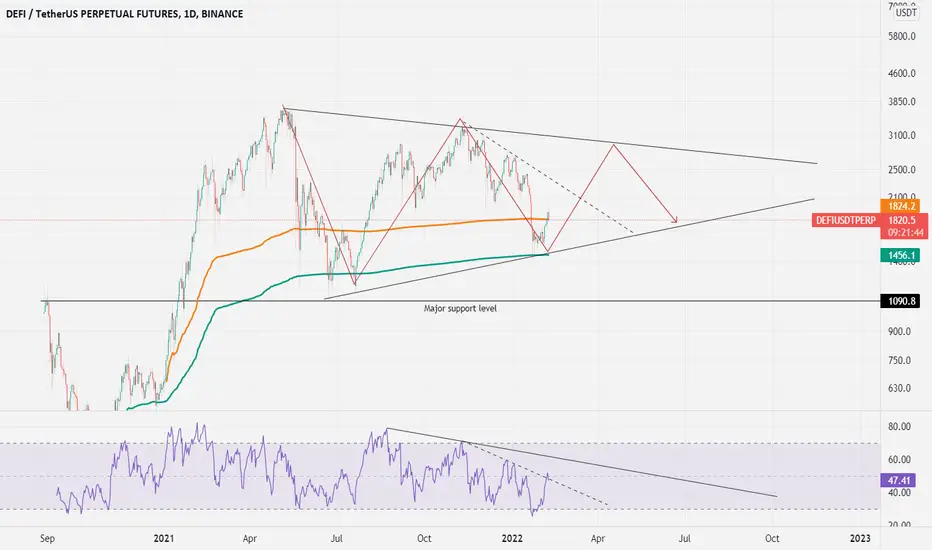
On my latest post, I mentioned that 1900 usdt was an important area to watch and which we were rejected.
On this set up, we can see that DEFI/USDT is forming a triangle on the LOG chart.
The RSI shows that we will enter in a long period of consolidation(look at the descending trend lines), however we will have some excellent gains if we play it well.
When we see this chart, we can be bullish on the defi coins until we touch the upper line of the triangle which we will exit positions & wait and see.
Follow for more updates.
On this set up, we can see that DEFI/USDT is forming a triangle on the LOG chart.
The RSI shows that we will enter in a long period of consolidation(look at the descending trend lines), however we will have some excellent gains if we play it well.
When we see this chart, we can be bullish on the defi coins until we touch the upper line of the triangle which we will exit positions & wait and see.
Follow for more updates.

関連の投稿
免責事項
これらの情報および投稿は、TradingViewが提供または承認する金融、投資、取引、またはその他の種類の助言もしくは推奨であることを意図したものではなく、またこれらに該当するものでもありません。詳細は利用規約をご覧ください。
免責事項
これらの情報および投稿は、TradingViewが提供または承認する金融、投資、取引、またはその他の種類の助言もしくは推奨であることを意図したものではなく、またこれらに該当するものでもありません。詳細は利用規約をご覧ください。