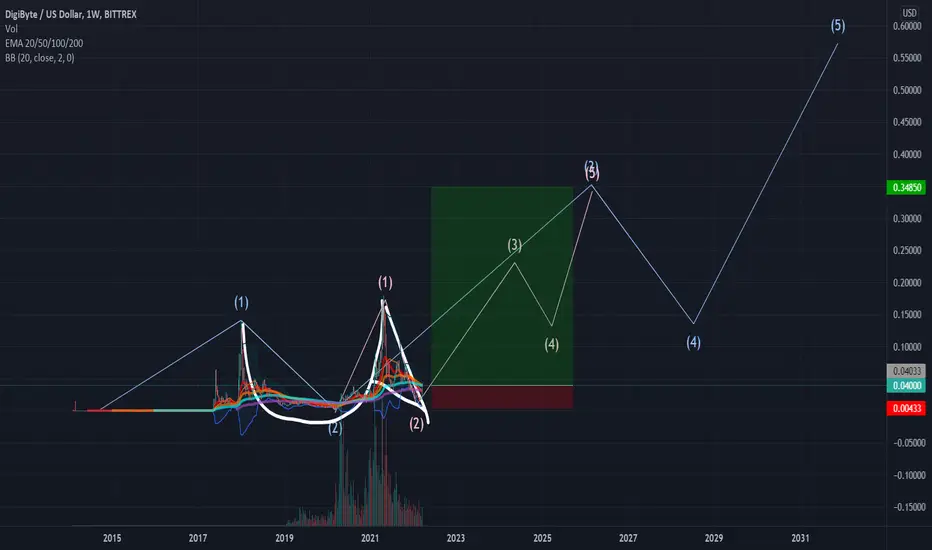
Testing/tracking elliot wave theory. Please do not trade off idea without S/L. Not financial advice.
Link to previous chart:
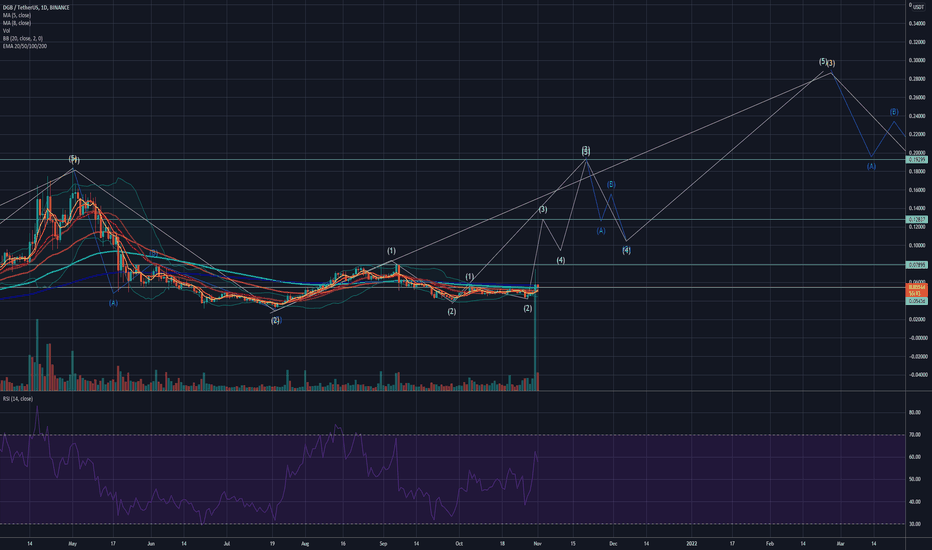
If you press play on the previous chart, you'll see that my wave count is off and it has been looking for a bottom. The new chart is changed from the daily to the weekly. The daily chart does not give enough info to count the waves. This weekly chart dates all the way back to 14' which will give us a more accurate data to count waves. On the new chart you can see a giant cup and handle. This recent pump might be the breakout of the bull flag. If the counts are correct, the bottom is in.
Wave 3 target: 0.35
Link to previous chart:
If you press play on the previous chart, you'll see that my wave count is off and it has been looking for a bottom. The new chart is changed from the daily to the weekly. The daily chart does not give enough info to count the waves. This weekly chart dates all the way back to 14' which will give us a more accurate data to count waves. On the new chart you can see a giant cup and handle. This recent pump might be the breakout of the bull flag. If the counts are correct, the bottom is in.
Wave 3 target: 0.35

免責事項
これらの情報および投稿は、TradingViewが提供または承認する金融、投資、取引、またはその他の種類の助言もしくは推奨であることを意図したものではなく、またこれらに該当するものでもありません。詳細は利用規約をご覧ください。
免責事項
これらの情報および投稿は、TradingViewが提供または承認する金融、投資、取引、またはその他の種類の助言もしくは推奨であることを意図したものではなく、またこれらに該当するものでもありません。詳細は利用規約をご覧ください。