
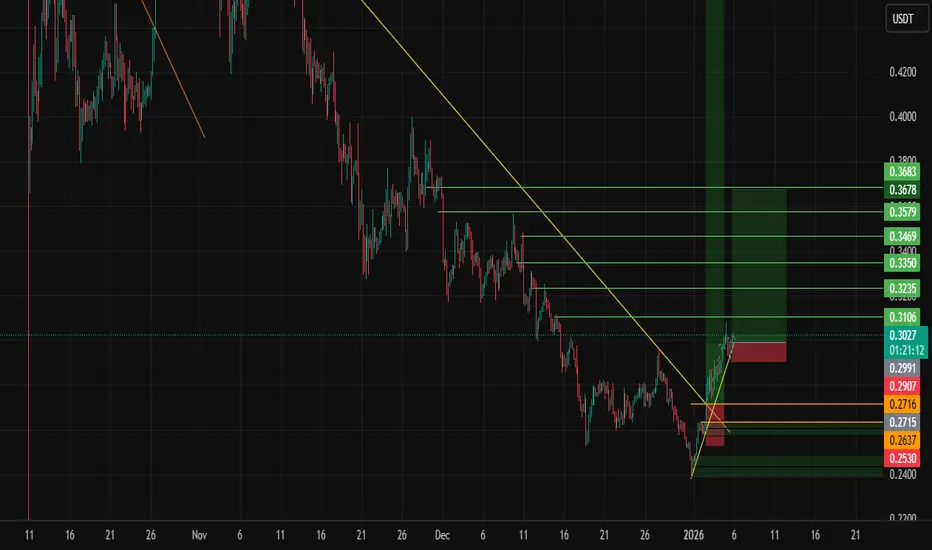
📢 Trade Setup – DIA/USDT
📈 Position: LONG
💰 Entry Zone:
0.3024– 0.2959
(Key demand & trendline retest area shown on chart)
🛑 Stop-Loss:
0.29
(Below structure low & invalidation zone)
🎯 Take-Profit Targets:
• TP1: 0.3106
• TP2: 0.3335
• TP3: 0.33350
• TP4: 0.3469
• TP5: 0.3579
• TP6: 0.3678
📊 Timeframe: 1H
⚙️ Market: Futures / Spot
⚖️ Risk–Reward: High R:R (step-by-step scaling)
🧠 Chart Analysis (Based on the Image):
DIA has broken the long-term descending trendline with strong bullish momentum.
Price formed a higher low after a sharp impulsive move, confirming trend reversal.
Current pullback is a healthy retest into the previous breakout zone.
Multiple green targets align with key resistance & liquidity levels marked on the chart.
Overall structure has shifted from bearish → bullish continuation.
📌 Trade Management Rules:
✔️ Take partial profit at each TP
✔️ After TP1 → move SL to Break Even
✔️ Trail SL below higher lows
✔️ Risk per trade: 1–2% MAX
✔️ Avoid over-leverage during pullback entries
💥 Suggested Leverage:
3× – 5× (maximum)
⚠️ Invalidation:
If price closes below 0.29 0, the bullish setup is invalid.
If you want next:
• Update after TP hits
• Short scenario if structure fails
📈 Position: LONG
💰 Entry Zone:
0.3024– 0.2959
(Key demand & trendline retest area shown on chart)
🛑 Stop-Loss:
0.29
(Below structure low & invalidation zone)
🎯 Take-Profit Targets:
• TP1: 0.3106
• TP2: 0.3335
• TP3: 0.33350
• TP4: 0.3469
• TP5: 0.3579
• TP6: 0.3678
📊 Timeframe: 1H
⚙️ Market: Futures / Spot
⚖️ Risk–Reward: High R:R (step-by-step scaling)
🧠 Chart Analysis (Based on the Image):
DIA has broken the long-term descending trendline with strong bullish momentum.
Price formed a higher low after a sharp impulsive move, confirming trend reversal.
Current pullback is a healthy retest into the previous breakout zone.
Multiple green targets align with key resistance & liquidity levels marked on the chart.
Overall structure has shifted from bearish → bullish continuation.
📌 Trade Management Rules:
✔️ Take partial profit at each TP
✔️ After TP1 → move SL to Break Even
✔️ Trail SL below higher lows
✔️ Risk per trade: 1–2% MAX
✔️ Avoid over-leverage during pullback entries
💥 Suggested Leverage:
3× – 5× (maximum)
⚠️ Invalidation:
If price closes below 0.29 0, the bullish setup is invalid.
If you want next:
• Update after TP hits
• Short scenario if structure fails

免責事項
これらの情報および投稿は、TradingViewが提供または承認する金融、投資、取引、またはその他の種類の助言もしくは推奨であることを意図したものではなく、またこれらに該当するものでもありません。詳細は利用規約をご覧ください。
免責事項
これらの情報および投稿は、TradingViewが提供または承認する金融、投資、取引、またはその他の種類の助言もしくは推奨であることを意図したものではなく、またこれらに該当するものでもありません。詳細は利用規約をご覧ください。