
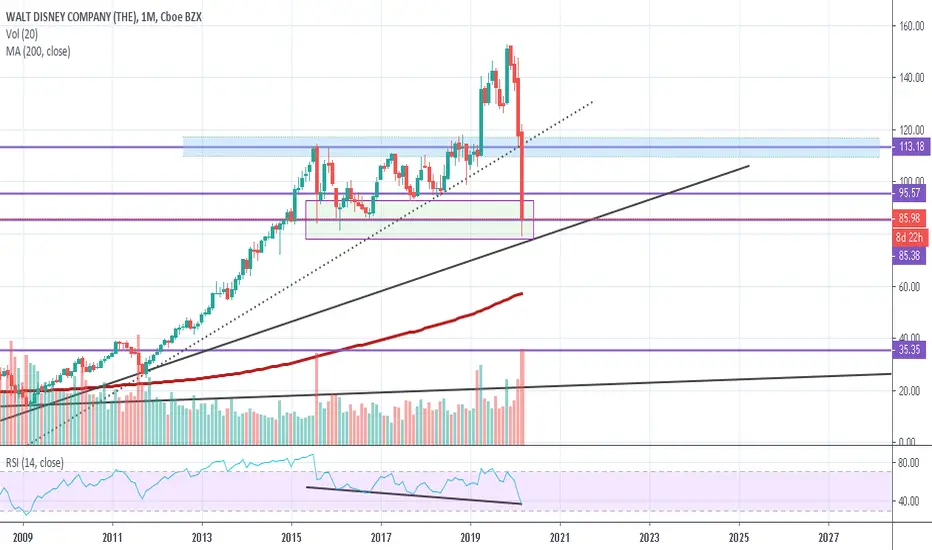
We can see on Disney monthly chart that as the price returning at the level of 85$ in the Rsi chart the line is going down and down. So as it appears we might see a true bullish divergence. In addition that $85 level is a strong support zone and the volume in the last candle was very strong i think that the trend might changes and reverses from that point.
(But is also the coronovirus matter in the other hand so..)
(But is also the coronovirus matter in the other hand so..)

免責事項
これらの情報および投稿は、TradingViewが提供または承認する金融、投資、取引、またはその他の種類の助言もしくは推奨であることを意図したものではなく、またこれらに該当するものでもありません。詳細は利用規約をご覧ください。
免責事項
これらの情報および投稿は、TradingViewが提供または承認する金融、投資、取引、またはその他の種類の助言もしくは推奨であることを意図したものではなく、またこれらに該当するものでもありません。詳細は利用規約をご覧ください。