
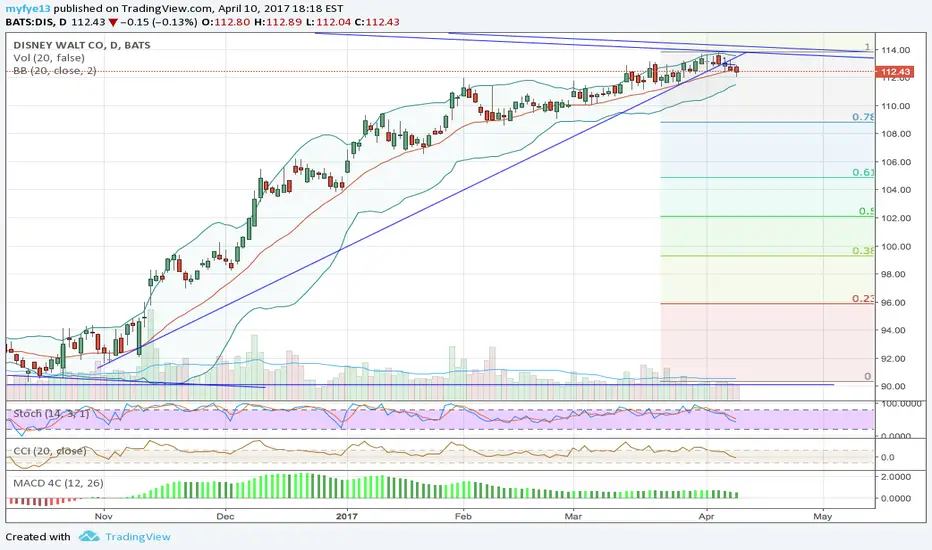
Disney has been riding the magic middle bollinger band (20 DMA) carpet ride since 10/21/2016. Today we closed below it. Every time there has been a close below it the next day has been positive. However, we are at the top of a long-term channel and based on the weekly indicators, the stock has been overbought for some time now (see below)

I think the next few days will tell us if the stock is going to continue falling back to the bottom of the channel or if it will push through (channel looks awfully like a bullish flag, so this could just be consolidation).
I think the next few days will tell us if the stock is going to continue falling back to the bottom of the channel or if it will push through (channel looks awfully like a bullish flag, so this could just be consolidation).
ノート
Stock opened higher today before falling back down to and bouncing off of the 20 DMA. Bollinger Bands are tight, I would be careful taking a position until we get a breakout one way or the other on above average volume.
関連の投稿
免責事項
これらの情報および投稿は、TradingViewが提供または承認する金融、投資、取引、またはその他の種類の助言もしくは推奨であることを意図したものではなく、またこれらに該当するものでもありません。詳細は利用規約をご覧ください。
免責事項
これらの情報および投稿は、TradingViewが提供または承認する金融、投資、取引、またはその他の種類の助言もしくは推奨であることを意図したものではなく、またこれらに該当するものでもありません。詳細は利用規約をご覧ください。