
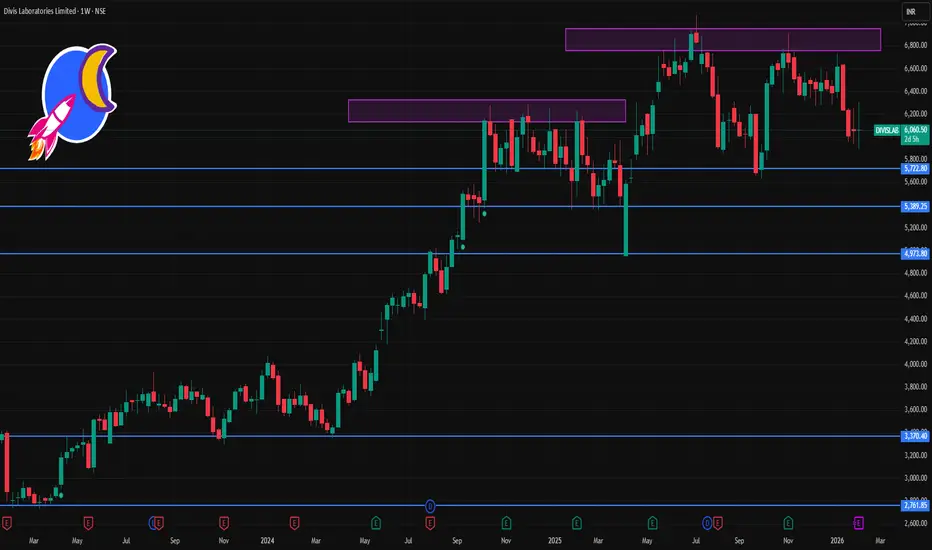
📌 Current Price Snapshot (latest)
Latest traded price around ₹6,056 – ₹6,056.50 (NSE) in early Feb 2026.
📈 Weekly Support & Resistance Levels (1-Week Time Frame)
📊 Key Levels for This Week (approx based on technical forecasting):
Level Type Price Level (₹)
Strong Resistance 3 (R3) ~6,496.8
Resistance 2 (R2) ~6,377.2
Resistance 1 (R1) ~6,194.3
Current Box Top Level (upper range) ~6,496
Support 1 (S1) ~5,891.8
Support 2 (S2) ~5,772.2
Strong Support 3 (S3) ~5,589.3
➡️ This implies the expected weekly trading range is roughly ₹5,590 – ₹6,495 if the stock remains within normal price swings this week.
🔍 Short-Term Technical Context
Price currently below many key moving averages (5, 10, 20 SMA etc.) indicating bearish bias in short term.
Momentum indicators like RSI and MACD show neutral to bearish positioning, suggesting limited upside unless buyers step in strongly.
📌 How To Use These Levels
Bullish trigger levels:
✔ Above ~₹6,194 (R1) — short-term upside bias
✔ Above ~₹6,377 (R2) — stronger bullish sentiment this week
Bearish trigger levels:
🔻 Below ~₹5,891 (S1) — indicates selling pressure
🔻 Below ~₹5,772 (S2) — more downside risk
📌 Summary Weekly View
Expected trading range this week: ₹5,590 – ₹6,495
Near-term resistance: ~₹6,194 → ~₹6,377
Near-term support: ~₹5,891 → ~₹5,772 (secondary)
📍 All levels are based on technical forecasts and pivots — not guaranteed — and actual price action may vary with market conditions.

Contact Knowledgehub for a detailed consultation: Dm on WhatsApp: [wa.link/a2o0kz]-
Phone No: [+91 93102 26243]-
Email: [tradingviewknowledgehub@gmail.com]---
-- Let’s achieve success together!
Phone No: [+91 93102 26243]-
Email: [tradingviewknowledgehub@gmail.com]---
-- Let’s achieve success together!
関連の投稿
免責事項
これらの情報および投稿は、TradingViewが提供または承認する金融、投資、取引、またはその他の種類の助言もしくは推奨であることを意図したものではなく、またこれらに該当するものでもありません。詳細は利用規約をご覧ください。