
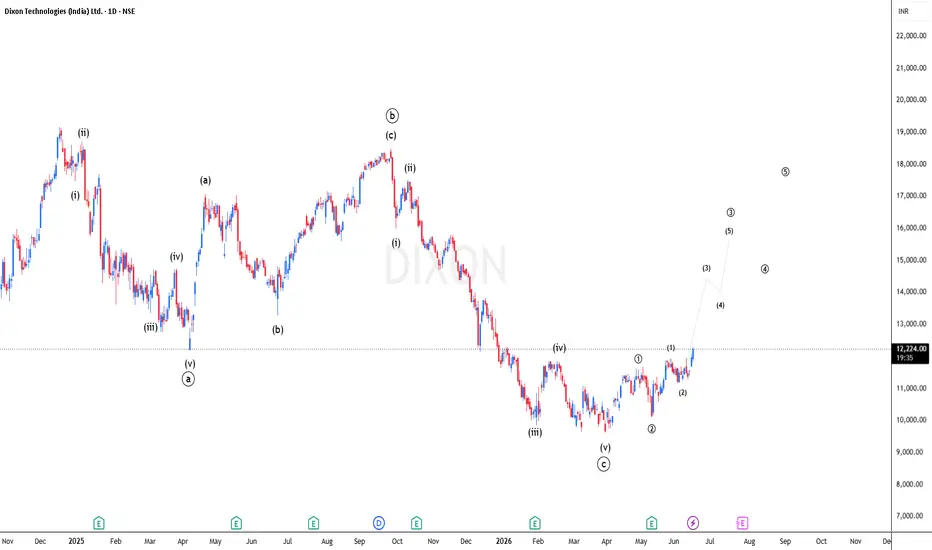
**Dixon Technologies – Elliott Wave Analysis 🚀📈**
The chart suggests that **Wave 3 is unfolding within a larger Wave 3**, a setup that is often considered the most powerful phase in Elliott Wave Theory.
🔹 The major **ABC corrective structure** appears to be complete.
🔹 Waves **(1)** and **(2)** have likely finished, confirming the start of a new bullish cycle.
🔹 The stock now seems to be entering **Wave 3 of Wave 3**, which typically delivers the strongest momentum and sharpest price advance.
🔹 As long as the recent Wave (2) low remains intact, the bullish structure stays valid.
**Wave 3 of 3 is in progress — a phase where strong momentum and accelerated upside moves are often seen.** 🚀📊

免責事項
これらの情報および投稿は、TradingViewが提供または承認する金融、投資、取引、またはその他の種類の助言もしくは推奨であることを意図したものではなく、またこれらに該当するものでもありません。詳細は利用規約をご覧ください。
免責事項
これらの情報および投稿は、TradingViewが提供または承認する金融、投資、取引、またはその他の種類の助言もしくは推奨であることを意図したものではなく、またこれらに該当するものでもありません。詳細は利用規約をご覧ください。