
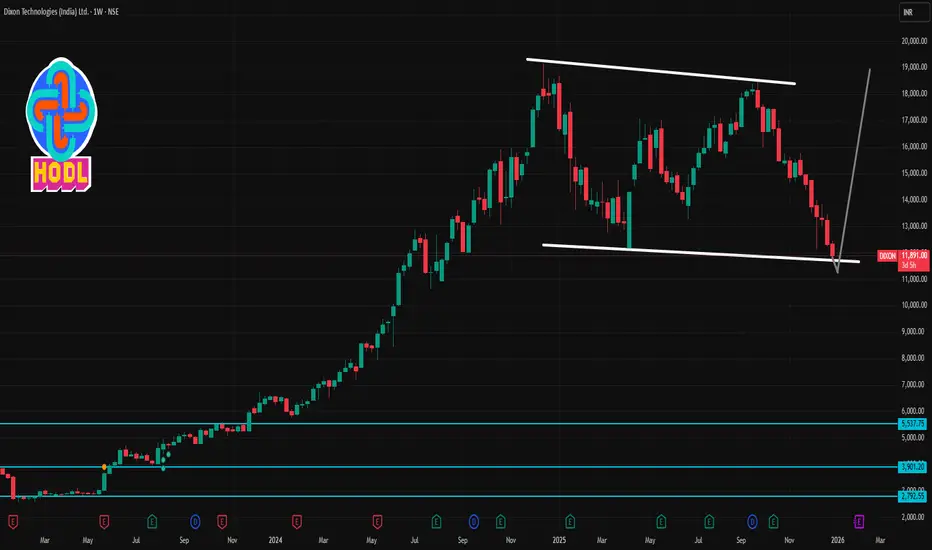
📉 Current Context
The stock is trading near its 52-week low area (~₹11,700-₹12,000) and prices have been under pressure recently with weak momentum on daily and weekly charts.
Technical indicators show bearish sentiment in the short term.
📊 Weekly Technical Levels (1-Week Range)
🔹 Immediate Support Levels
1. ₹11,903 – Immediate Weekly Support
A key support for the upcoming week — if decisively broken, further downside could accelerate.
2. ₹11,479 – Secondary Support
A deeper support zone below the first level, historically seen as a reaction area.
3. ₹10,708 – Major Lower Support
Stronger long-term support if weakness intensifies — a break below here implies extended downtrend.
🔹 Resistance Levels
1. ₹13,098 – Immediate Weekly Resistance
First meaningful upside barrier; a close above this signals short-term relief.
2. ₹13,869 – Major Weekly Resistance
If price sustains above the first resistance, this is the next meaningful challenge.
3. Higher Zone: 13,800-14,000+
General overhead area where sellers may step in (also seen in other pivot/weekly structures).
📉 Short-Term Risk Indicators
Technical oscillators and moving averages on daily/weekly remain weak/oversold — signaling bearish momentum, though oversold conditions can also lead to short bounces.
Recent rebound attempts show the stock is still vulnerable unless clear upside breakout occurs.
📌 How Traders Use This
Short-term longs may target ₹13,098 to ₹13,800 (with strict stops below ₹11,900).
Short positions/continuation trades might aim for breakdown confirmation below ₹11,903, targeting ₹11,479 / ₹10,700.
Weekly closes (not just intraday) above ₹13,098 or below ₹11,903 are stronger confirmations.
The stock is trading near its 52-week low area (~₹11,700-₹12,000) and prices have been under pressure recently with weak momentum on daily and weekly charts.
Technical indicators show bearish sentiment in the short term.
📊 Weekly Technical Levels (1-Week Range)
🔹 Immediate Support Levels
1. ₹11,903 – Immediate Weekly Support
A key support for the upcoming week — if decisively broken, further downside could accelerate.
2. ₹11,479 – Secondary Support
A deeper support zone below the first level, historically seen as a reaction area.
3. ₹10,708 – Major Lower Support
Stronger long-term support if weakness intensifies — a break below here implies extended downtrend.
🔹 Resistance Levels
1. ₹13,098 – Immediate Weekly Resistance
First meaningful upside barrier; a close above this signals short-term relief.
2. ₹13,869 – Major Weekly Resistance
If price sustains above the first resistance, this is the next meaningful challenge.
3. Higher Zone: 13,800-14,000+
General overhead area where sellers may step in (also seen in other pivot/weekly structures).
📉 Short-Term Risk Indicators
Technical oscillators and moving averages on daily/weekly remain weak/oversold — signaling bearish momentum, though oversold conditions can also lead to short bounces.
Recent rebound attempts show the stock is still vulnerable unless clear upside breakout occurs.
📌 How Traders Use This
Short-term longs may target ₹13,098 to ₹13,800 (with strict stops below ₹11,900).
Short positions/continuation trades might aim for breakdown confirmation below ₹11,903, targeting ₹11,479 / ₹10,700.
Weekly closes (not just intraday) above ₹13,098 or below ₹11,903 are stronger confirmations.

Contact Knowledgehub for a detailed consultation: Dm on WhatsApp: [wa.link/a2o0kz]-
Phone No: [+91 93102 26243]-
Email: [tradingviewknowledgehub@gmail.com]---
-- Let’s achieve success together!
Phone No: [+91 93102 26243]-
Email: [tradingviewknowledgehub@gmail.com]---
-- Let’s achieve success together!
関連の投稿
免責事項
これらの情報および投稿は、TradingViewが提供または承認する金融、投資、取引、またはその他の種類の助言もしくは推奨であることを意図したものではなく、またこれらに該当するものでもありません。詳細は利用規約をご覧ください。
Contact Knowledgehub for a detailed consultation: Dm on WhatsApp: [wa.link/a2o0kz]-
Phone No: [+91 93102 26243]-
Email: [tradingviewknowledgehub@gmail.com]---
-- Let’s achieve success together!
Phone No: [+91 93102 26243]-
Email: [tradingviewknowledgehub@gmail.com]---
-- Let’s achieve success together!
関連の投稿
免責事項
これらの情報および投稿は、TradingViewが提供または承認する金融、投資、取引、またはその他の種類の助言もしくは推奨であることを意図したものではなく、またこれらに該当するものでもありません。詳細は利用規約をご覧ください。