
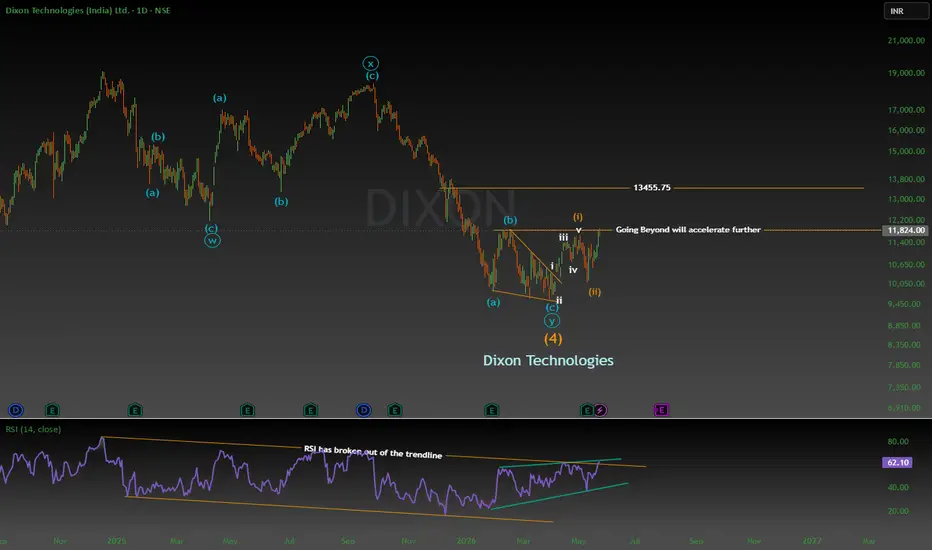
This is a detailed Elliott / Neo Wave styled analysis chart of Dixon Technologies (India) Ltd on the 1-Day time-frame, combining price structure with RSI momentum analysis.
Overall Structure
The chart suggests that Dixon completed a large corrective structure labeled as:
W–X–Y corrective formation
Followed by a possible Wave (4) correction completion
Price now appears to be transitioning into an impulsive bullish advance.
The analyst is tracking an emerging 5-wave impulsive move upward from the recent lows.
Price Action Interpretation
Earlier Corrective Phase
The left side of the chart shows:
Multiple (a)-(b)-(c) corrective swings
A complex corrective combination:
W
X
Y
This indicates:
The stock underwent a prolonged consolidation/correction after previous highs near ₹18k–19k.
The correction appears mature and possibly completed.
Current Bullish Structure
Near the recent bottom around ₹9,600:
The chart labels a completed Wave (4) in orange.
From there, a fresh impulse seems to have started.
The current advance is counted as:
(i) → initial breakout leg
(ii) → pullback
Then developing:
i
ii
iii
iv
possible ongoing (iii)
This nested wave count implies:
The market may be in an early stage of a stronger uptrend.
A breakout above resistance could trigger acceleration.
Key Resistance Levels
Immediate Resistance
Around:
₹11,824
This horizontal orange line is the current breakout trigger zone.
The annotation says:
“Going beyond will accelerate further”
Meaning:
Sustained closing above ₹11,847 could confirm bullish continuation.
Major Resistance
Next important level:
₹13,455.75
This appears to be:
Higher timeframe resistance
Possible target zone after breakout confirmation.
Channel / Wedge Structure
The recent move is drawn inside:
A narrowing bullish wedge/channel.
Interpretation:
Compression before expansion.
Price recently pushed upward from the lower boundary.
Often precedes a momentum breakout.
RSI Analysis
RSI panel at bottom shows:
Bullish RSI Breakout
RSI previously stayed inside a falling channel.
It has now:
Broken above the descending trendline
Formed a rising structure
Current RSI:
Around 62
This supports:
Increasing bullish momentum
Momentum confirmation for the wave count
The analyst explicitly marks:
“RSI has broken out of the trendline”
which strengthens the bullish case.
Technical Conclusion
The chart is signaling:
Bullish Scenario
If price sustains above:
₹11,847
then:
Wave (iii) / (5) expansion may begin
Momentum could accelerate toward:
₹13,455+
and potentially higher later.
Invalidation / Risk Area
If price fails and breaks below:
recent swing lows near ₹10,000–10,200
then:
The impulsive count may weaken.
Current move could instead remain corrective.
This is not a buy/sell reco. Iam not a sebi registered analyst. May consult ur FA before investing/trading.
Overall Structure
The chart suggests that Dixon completed a large corrective structure labeled as:
W–X–Y corrective formation
Followed by a possible Wave (4) correction completion
Price now appears to be transitioning into an impulsive bullish advance.
The analyst is tracking an emerging 5-wave impulsive move upward from the recent lows.
Price Action Interpretation
Earlier Corrective Phase
The left side of the chart shows:
Multiple (a)-(b)-(c) corrective swings
A complex corrective combination:
W
X
Y
This indicates:
The stock underwent a prolonged consolidation/correction after previous highs near ₹18k–19k.
The correction appears mature and possibly completed.
Current Bullish Structure
Near the recent bottom around ₹9,600:
The chart labels a completed Wave (4) in orange.
From there, a fresh impulse seems to have started.
The current advance is counted as:
(i) → initial breakout leg
(ii) → pullback
Then developing:
i
ii
iii
iv
possible ongoing (iii)
This nested wave count implies:
The market may be in an early stage of a stronger uptrend.
A breakout above resistance could trigger acceleration.
Key Resistance Levels
Immediate Resistance
Around:
₹11,824
This horizontal orange line is the current breakout trigger zone.
The annotation says:
“Going beyond will accelerate further”
Meaning:
Sustained closing above ₹11,847 could confirm bullish continuation.
Major Resistance
Next important level:
₹13,455.75
This appears to be:
Higher timeframe resistance
Possible target zone after breakout confirmation.
Channel / Wedge Structure
The recent move is drawn inside:
A narrowing bullish wedge/channel.
Interpretation:
Compression before expansion.
Price recently pushed upward from the lower boundary.
Often precedes a momentum breakout.
RSI Analysis
RSI panel at bottom shows:
Bullish RSI Breakout
RSI previously stayed inside a falling channel.
It has now:
Broken above the descending trendline
Formed a rising structure
Current RSI:
Around 62
This supports:
Increasing bullish momentum
Momentum confirmation for the wave count
The analyst explicitly marks:
“RSI has broken out of the trendline”
which strengthens the bullish case.
Technical Conclusion
The chart is signaling:
Bullish Scenario
If price sustains above:
₹11,847
then:
Wave (iii) / (5) expansion may begin
Momentum could accelerate toward:
₹13,455+
and potentially higher later.
Invalidation / Risk Area
If price fails and breaks below:
recent swing lows near ₹10,000–10,200
then:
The impulsive count may weaken.
Current move could instead remain corrective.
This is not a buy/sell reco. Iam not a sebi registered analyst. May consult ur FA before investing/trading.

免責事項
これらの情報および投稿は、TradingViewが提供または承認する金融、投資、取引、またはその他の種類の助言もしくは推奨であることを意図したものではなく、またこれらに該当するものでもありません。詳細は利用規約をご覧ください。
免責事項
これらの情報および投稿は、TradingViewが提供または承認する金融、投資、取引、またはその他の種類の助言もしくは推奨であることを意図したものではなく、またこれらに該当するものでもありません。詳細は利用規約をご覧ください。