
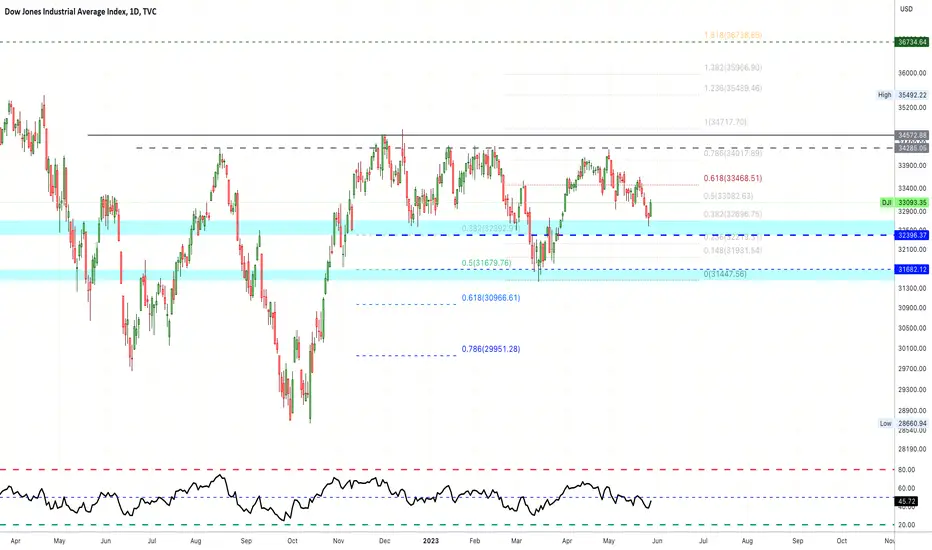
The Dow Jones have been left behind compared to the SPX and NDX but the chart still looks pretty good.
We have a hammer 25-May after a months long correction, followed by a full green candle. This is a reversal signal with confirmation the next day.
We just need to see follow up on Monday but looking at the three major indexes together, SPX, DJI and NDX, we are going to call it bullish.
The blue spaces on the chart is the strong support.
The DJI is trading within a long-term higher low.
The bias is 100% bullish.
We will see how it goes but we expect it to grow in the short-term based on the current look of the chart.
This can change if the support levels break.
If support remains intact, up we go!
Namaste.
We have a hammer 25-May after a months long correction, followed by a full green candle. This is a reversal signal with confirmation the next day.
We just need to see follow up on Monday but looking at the three major indexes together, SPX, DJI and NDX, we are going to call it bullish.
The blue spaces on the chart is the strong support.
The DJI is trading within a long-term higher low.
The bias is 100% bullish.
We will see how it goes but we expect it to grow in the short-term based on the current look of the chart.
This can change if the support levels break.
If support remains intact, up we go!
Namaste.
ノート
Nailed it. Going up and now facing resistance.
✅ Cryptocurrencies technical analysis & results
t.me/masteranandatrades/9279
✅ Stocks technical analysis
t.me/anandastocks
✅ Enjoyed the content? Join my PREMIUM channels for more... t.me/lamatrades/4 (since 2017)
t.me/masteranandatrades/9279
✅ Stocks technical analysis
t.me/anandastocks
✅ Enjoyed the content? Join my PREMIUM channels for more... t.me/lamatrades/4 (since 2017)
関連の投稿
免責事項
これらの情報および投稿は、TradingViewが提供または承認する金融、投資、取引、またはその他の種類の助言もしくは推奨であることを意図したものではなく、またこれらに該当するものでもありません。詳細は利用規約をご覧ください。
✅ Cryptocurrencies technical analysis & results
t.me/masteranandatrades/9279
✅ Stocks technical analysis
t.me/anandastocks
✅ Enjoyed the content? Join my PREMIUM channels for more... t.me/lamatrades/4 (since 2017)
t.me/masteranandatrades/9279
✅ Stocks technical analysis
t.me/anandastocks
✅ Enjoyed the content? Join my PREMIUM channels for more... t.me/lamatrades/4 (since 2017)
関連の投稿
免責事項
これらの情報および投稿は、TradingViewが提供または承認する金融、投資、取引、またはその他の種類の助言もしくは推奨であることを意図したものではなく、またこれらに該当するものでもありません。詳細は利用規約をご覧ください。