
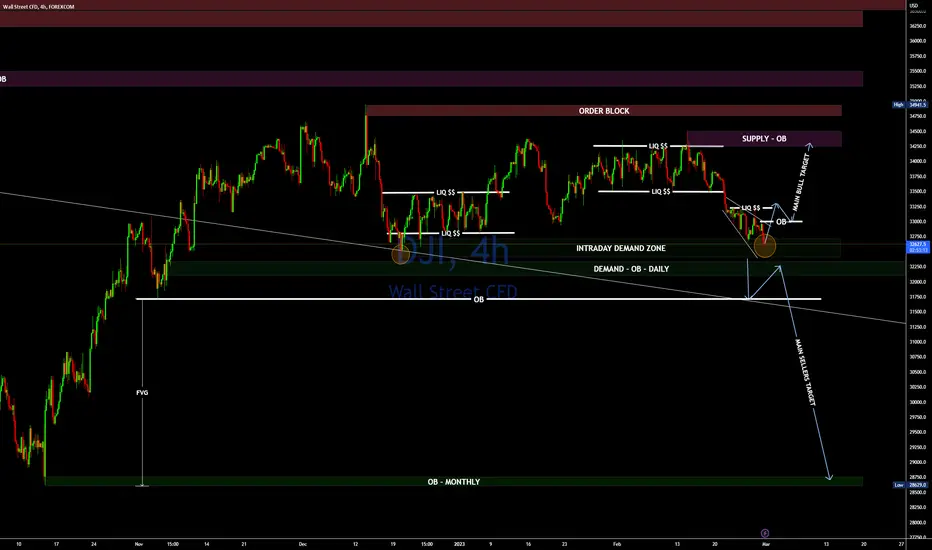
On a weekly chart, the price broke above the upper band of an expanding wedge channel, now it just made its second retest of the upper band- making that level a bit more stronger (provided it does not get broken).
So, i am having 2 bias, one is mid-term bullish bias as shown in the above chart. A break above the Intraday - OB followed by a retest would mean that buyers are still very much interested in riding the price back up.
Alternatively, if the price break down and fall back inside the wedge (weekly) then the FVG could get filled up and it's going to be a quick bearish down pour.
So, stay close and watch how it plays out.
So, i am having 2 bias, one is mid-term bullish bias as shown in the above chart. A break above the Intraday - OB followed by a retest would mean that buyers are still very much interested in riding the price back up.
Alternatively, if the price break down and fall back inside the wedge (weekly) then the FVG could get filled up and it's going to be a quick bearish down pour.
So, stay close and watch how it plays out.
ノート
IF THE BREKOUT HAPPENED SUCCESSFULLY, THEN WAIT FOR THE RETEST AS SHOWN BELOW :THEN LOOK FOR BUY OPPORTUNITY 👇
ノート
FOR AN AGGRESSIVE TRADERS, IT'S LOOKING LIKE CHRISTMAS, BUT FOR TRADERS ANTICIPATING FOR PULLBACK, IT'S STILL GOINIG TO COME.
免責事項
これらの情報および投稿は、TradingViewが提供または承認する金融、投資、取引、またはその他の種類の助言もしくは推奨であることを意図したものではなく、またこれらに該当するものでもありません。詳細は利用規約をご覧ください。
免責事項
これらの情報および投稿は、TradingViewが提供または承認する金融、投資、取引、またはその他の種類の助言もしくは推奨であることを意図したものではなく、またこれらに該当するものでもありません。詳細は利用規約をご覧ください。