
DOW Fans. We are getting close to a trough according to RVI !!!
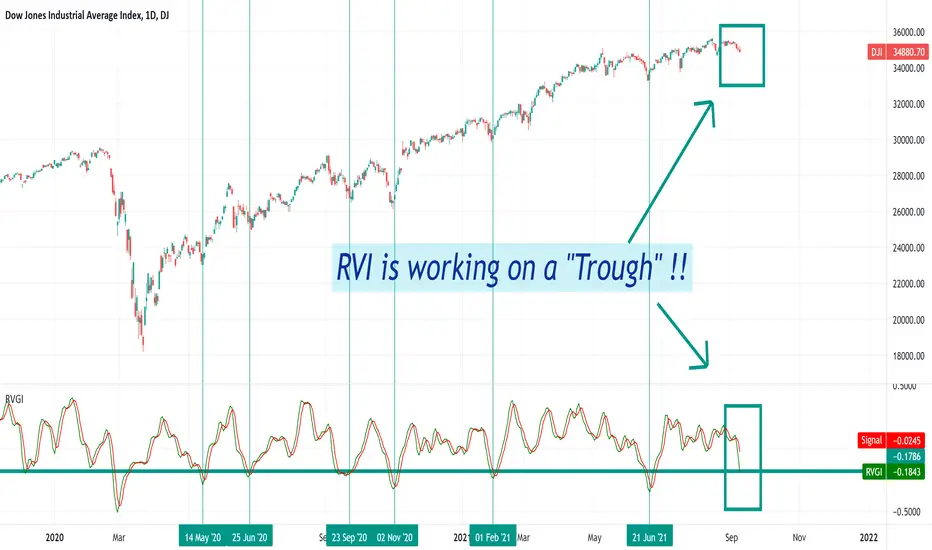
What Is the Relative Vigor Index?
The Relative Vigor Index (RVI) is a momentum indicator used in technical analysis that measures the strength of a trend by comparing a security's closing price to its trading range while smoothing the results using a simple moving average (SMA).
The RVI's usefulness is based on the observed tendency for prices to close higher than they open during uptrends, and to close lower than they open in downtrends.
KEY TAKEAWAYS
The Relative Vigor Index (RVI) is a technical momentum indicator.
The RVI oscillates across a pre-determined center line rather than a banded trend.
Divergences between the RVI indicator and price suggest there will be a near-term change in the trend.
The Relative Vigor Index (RVI) is a momentum indicator used in technical analysis that measures the strength of a trend by comparing a security's closing price to its trading range while smoothing the results using a simple moving average (SMA).
The RVI's usefulness is based on the observed tendency for prices to close higher than they open during uptrends, and to close lower than they open in downtrends.
KEY TAKEAWAYS
The Relative Vigor Index (RVI) is a technical momentum indicator.
The RVI oscillates across a pre-determined center line rather than a banded trend.
Divergences between the RVI indicator and price suggest there will be a near-term change in the trend.
ノート
RVI printing -.2253 & signal line printing -.1179 . No sign of reversal or a trough in place !!!
ノート
NO crossing over the signal line on "All time frames" !!! go figure !!! NO trough in place so far according to this indicator !!!

I do more in depth studies of stocks on my twitter account. Hope you would enjoy it there as you are enjoying it here.
****** Past performance is no guarantee of future results***
twitter.com/samitrading1
****** Past performance is no guarantee of future results***
twitter.com/samitrading1
免責事項
これらの情報および投稿は、TradingViewが提供または承認する金融、投資、取引、またはその他の種類の助言もしくは推奨であることを意図したものではなく、またこれらに該当するものでもありません。詳細は利用規約をご覧ください。
I do more in depth studies of stocks on my twitter account. Hope you would enjoy it there as you are enjoying it here.
****** Past performance is no guarantee of future results***
twitter.com/samitrading1
****** Past performance is no guarantee of future results***
twitter.com/samitrading1
免責事項
これらの情報および投稿は、TradingViewが提供または承認する金融、投資、取引、またはその他の種類の助言もしくは推奨であることを意図したものではなく、またこれらに該当するものでもありません。詳細は利用規約をご覧ください。