
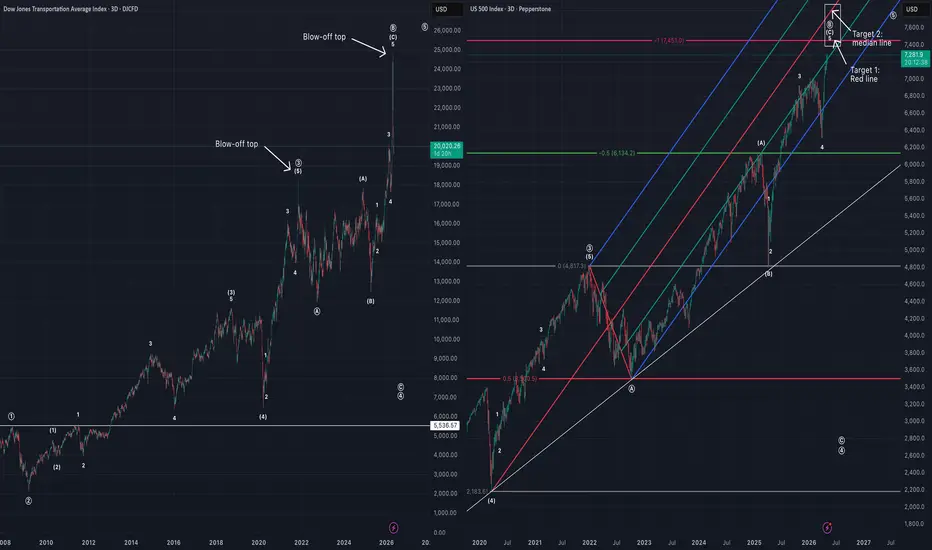
Chart comparing DJT and US500.
This comparison assumes both are in similar positions regarding their supercycle structures.
DJT has already completed its ((B)) wave with a blow-off top, as DJT tends to be a leading rather than lagging indicator for the larger equity markets.
US500 has been very technical since COVID low. I'm looking for it to top around 7451 or perhaps it goes a little bit extra to the median line target.
This comparison assumes both are in similar positions regarding their supercycle structures.
DJT has already completed its ((B)) wave with a blow-off top, as DJT tends to be a leading rather than lagging indicator for the larger equity markets.
US500 has been very technical since COVID low. I'm looking for it to top around 7451 or perhaps it goes a little bit extra to the median line target.

免責事項
これらの情報および投稿は、TradingViewが提供または承認する金融、投資、取引、またはその他の種類の助言もしくは推奨であることを意図したものではなく、またこれらに該当するものでもありません。詳細は利用規約をご覧ください。
免責事項
これらの情報および投稿は、TradingViewが提供または承認する金融、投資、取引、またはその他の種類の助言もしくは推奨であることを意図したものではなく、またこれらに該当するものでもありません。詳細は利用規約をご覧ください。