
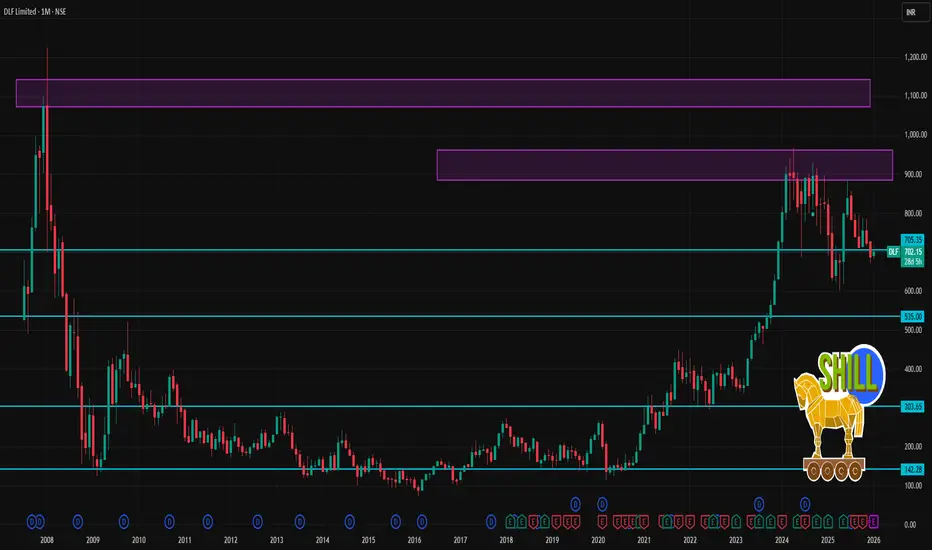
📌 Latest Price Snapshot
Current price: ~₹690‑₹705 range on NSE (as of early Jan 2026) — recent close ~₹691 – ₹703.80.
1‑month performance: Slightly down (~‑1% to ‑3%) over last month.
🧱 Important Support Levels
Level Price Notes
Support 1 (Immediate) ~₹690 Near current trading zone; key short‑term support.
Support 2 ~₹685‑₹688 Break below 690 could test here next.
Support 3 (Lower) ~₹678‑₹680 Lower short‑term support if sellers strengthen.
Lower 1‑Month Floor (historical) ~₹672 1‑month low seen.
🚧 Resistance Levels
Level Price Notes
Resistance 1 (near pivot) ~₹697‑₹702 First upside hurdle.
Resistance 2 ~₹708‑₹710 Next supply zone if price breaks above short resistance.
Higher resistance ~₹720+ Mid‑term barrier near 50‑day MA range.
📌 Short‑Term Pivot Points (Daily/Weekly Reference)
Pivot Zone: ~₹697‑₹698 — acts as a neutral technical pivot.
📉 Short‑Term Technical Momentum
RSI (14‑day): Neutral‑slightly bearish (~39‑42).
Moving Averages:
20‑day MA ~₹695‑701 (neutral).
50‑day MA ~₹722+ (resistance overhead).
Technical signals show a neutral to slightly bearish short‑term bias, with potential for range‑bound action between ₹680‑₹710 unless a breakout occurs.
📈 How to Interpret These Levels (1‑Month View)
Bullish Scenario
✔ Stay above ₹690‑₹695 → next move toward ₹702‑₹710
✔ Break above ₹710 → expands upside toward ~₹720+ resistance
Bearish Scenario
✘ Fails below ₹690 → could test ₹685‑₹680 zone
✘ Close below ₹678‑₹672 → stronger downside risk near recent lows
📊 Summary — 1‑Month Range (Practical Trading Levels)
👉 Bullish range breakout: above ₹702–₹710
👉 Bearish support breakdown: below ₹685–₹680
👉 In‑range trade: ₹680 ↔ ₹710
Current price: ~₹690‑₹705 range on NSE (as of early Jan 2026) — recent close ~₹691 – ₹703.80.
1‑month performance: Slightly down (~‑1% to ‑3%) over last month.
🧱 Important Support Levels
Level Price Notes
Support 1 (Immediate) ~₹690 Near current trading zone; key short‑term support.
Support 2 ~₹685‑₹688 Break below 690 could test here next.
Support 3 (Lower) ~₹678‑₹680 Lower short‑term support if sellers strengthen.
Lower 1‑Month Floor (historical) ~₹672 1‑month low seen.
🚧 Resistance Levels
Level Price Notes
Resistance 1 (near pivot) ~₹697‑₹702 First upside hurdle.
Resistance 2 ~₹708‑₹710 Next supply zone if price breaks above short resistance.
Higher resistance ~₹720+ Mid‑term barrier near 50‑day MA range.
📌 Short‑Term Pivot Points (Daily/Weekly Reference)
Pivot Zone: ~₹697‑₹698 — acts as a neutral technical pivot.
📉 Short‑Term Technical Momentum
RSI (14‑day): Neutral‑slightly bearish (~39‑42).
Moving Averages:
20‑day MA ~₹695‑701 (neutral).
50‑day MA ~₹722+ (resistance overhead).
Technical signals show a neutral to slightly bearish short‑term bias, with potential for range‑bound action between ₹680‑₹710 unless a breakout occurs.
📈 How to Interpret These Levels (1‑Month View)
Bullish Scenario
✔ Stay above ₹690‑₹695 → next move toward ₹702‑₹710
✔ Break above ₹710 → expands upside toward ~₹720+ resistance
Bearish Scenario
✘ Fails below ₹690 → could test ₹685‑₹680 zone
✘ Close below ₹678‑₹672 → stronger downside risk near recent lows
📊 Summary — 1‑Month Range (Practical Trading Levels)
👉 Bullish range breakout: above ₹702–₹710
👉 Bearish support breakdown: below ₹685–₹680
👉 In‑range trade: ₹680 ↔ ₹710

Contact Knowledgehub for a detailed consultation: Dm on WhatsApp: [wa.link/a2o0kz]-
Phone No: [+91 93102 26243]-
Email: [tradingviewknowledgehub@gmail.com]---
-- Let’s achieve success together!
Phone No: [+91 93102 26243]-
Email: [tradingviewknowledgehub@gmail.com]---
-- Let’s achieve success together!
関連の投稿
免責事項
これらの情報および投稿は、TradingViewが提供または承認する金融、投資、取引、またはその他の種類の助言もしくは推奨であることを意図したものではなく、またこれらに該当するものでもありません。詳細は利用規約をご覧ください。
Contact Knowledgehub for a detailed consultation: Dm on WhatsApp: [wa.link/a2o0kz]-
Phone No: [+91 93102 26243]-
Email: [tradingviewknowledgehub@gmail.com]---
-- Let’s achieve success together!
Phone No: [+91 93102 26243]-
Email: [tradingviewknowledgehub@gmail.com]---
-- Let’s achieve success together!
関連の投稿
免責事項
これらの情報および投稿は、TradingViewが提供または承認する金融、投資、取引、またはその他の種類の助言もしくは推奨であることを意図したものではなく、またこれらに該当するものでもありません。詳細は利用規約をご覧ください。