
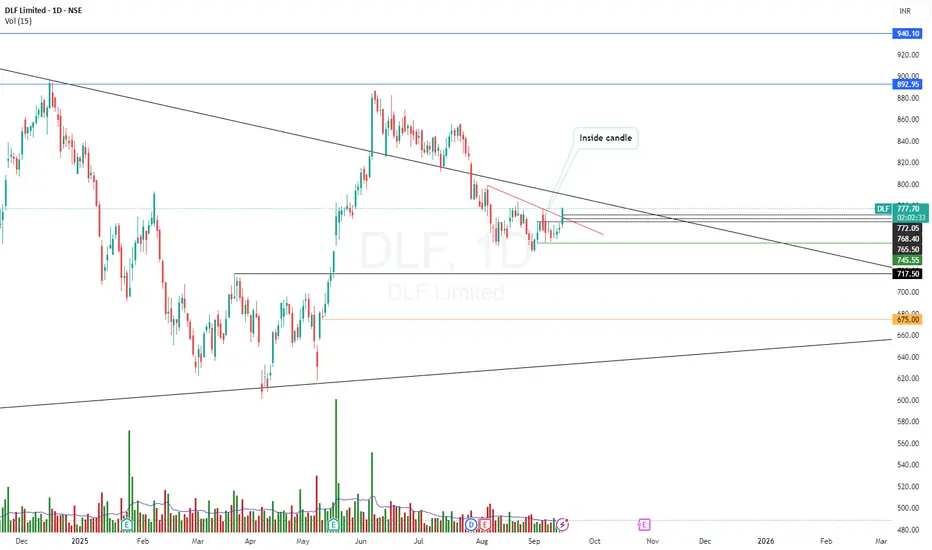
Current Technical Setup & Key Observations
200-DMA Breakout
Recently DLF closed above its 200-day moving average.
That generally signals a bullish bias in the medium-term, showing the trend may be shifting upward.
Inverse Head & Shoulders & Neckline Breakout
Earlier, DLF was reported to have broken out from an inverse head & shoulder pattern. Neckline breakout confirmed.
That sort of pattern can provide a “measured move” target calculated as height of pattern (distance from head to neckline) added to neckline level.
Candle Breakouts / Strong Candlestick Action
On shorter timeframes, there are signs of strong bullish candles and breakouts (i.e. candles closing above resistance levels, rejections of lower levels).
Also mention of patterns like bullish pennants / flags forming after upmove, indicating consolidation before continuation.
200-DMA Breakout
Recently DLF closed above its 200-day moving average.
That generally signals a bullish bias in the medium-term, showing the trend may be shifting upward.
Inverse Head & Shoulders & Neckline Breakout
Earlier, DLF was reported to have broken out from an inverse head & shoulder pattern. Neckline breakout confirmed.
That sort of pattern can provide a “measured move” target calculated as height of pattern (distance from head to neckline) added to neckline level.
Candle Breakouts / Strong Candlestick Action
On shorter timeframes, there are signs of strong bullish candles and breakouts (i.e. candles closing above resistance levels, rejections of lower levels).
Also mention of patterns like bullish pennants / flags forming after upmove, indicating consolidation before continuation.

免責事項
これらの情報および投稿は、TradingViewが提供または承認する金融、投資、取引、またはその他の種類の助言もしくは推奨であることを意図したものではなく、またこれらに該当するものでもありません。詳細は利用規約をご覧ください。
免責事項
これらの情報および投稿は、TradingViewが提供または承認する金融、投資、取引、またはその他の種類の助言もしくは推奨であることを意図したものではなく、またこれらに該当するものでもありません。詳細は利用規約をご覧ください。