
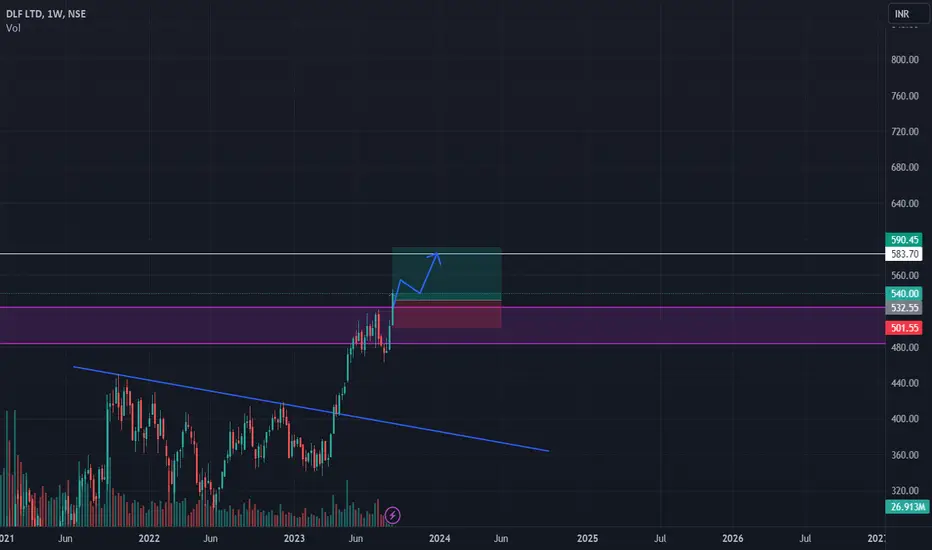
Based on my analysis of the DLF chart, I have identified some interesting price action patterns and key levels to keep an eye on. Here are the key points:
1. As on Friday it gives some sort of weekly breakout
2. come to daily time Friday , it seems to give good bullish move from here.
Considering the price action and the identified patterns, here's a potential trading strategy to consider:
Breakout patterns are generally reliable if it took many attempt to cross but could not make it in weekly tf, any how if this could happen , it is expected to move further in near future.
Please note that this analysis is purely based on price action observations and should not be considered as financial advice. Always conduct your own research and consider risk management strategies before making any trading decisions.
🙏 Disclaimer: [At the End "IT' S YOUR MONEY , IT'S YOUR DECISION]
1. As on Friday it gives some sort of weekly breakout
2. come to daily time Friday , it seems to give good bullish move from here.
Considering the price action and the identified patterns, here's a potential trading strategy to consider:
Breakout patterns are generally reliable if it took many attempt to cross but could not make it in weekly tf, any how if this could happen , it is expected to move further in near future.
Please note that this analysis is purely based on price action observations and should not be considered as financial advice. Always conduct your own research and consider risk management strategies before making any trading decisions.
🙏 Disclaimer: [At the End "IT' S YOUR MONEY , IT'S YOUR DECISION]

免責事項
これらの情報および投稿は、TradingViewが提供または承認する金融、投資、取引、またはその他の種類の助言もしくは推奨であることを意図したものではなく、またこれらに該当するものでもありません。詳細は利用規約をご覧ください。
免責事項
これらの情報および投稿は、TradingViewが提供または承認する金融、投資、取引、またはその他の種類の助言もしくは推奨であることを意図したものではなく、またこれらに該当するものでもありません。詳細は利用規約をご覧ください。