
30-11
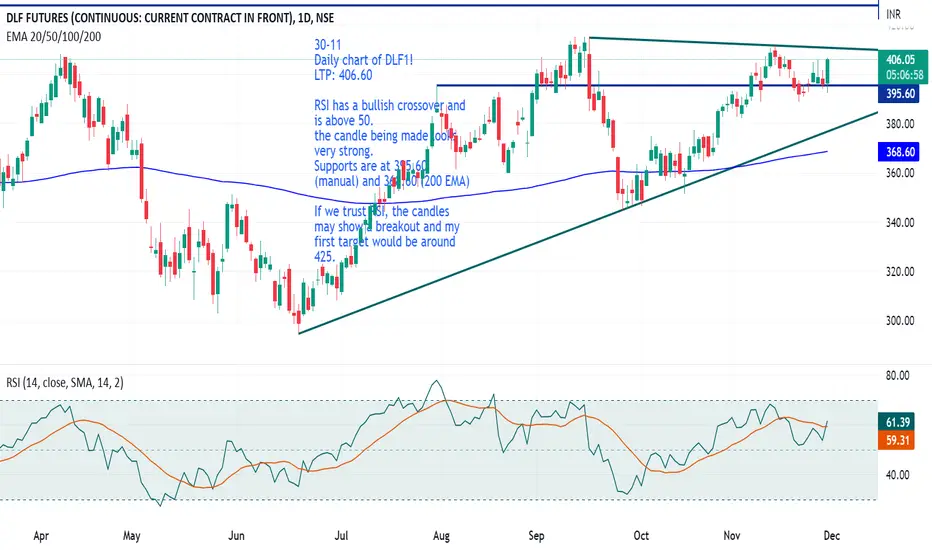
Daily chart of DLF1!
LTP: 406.60
RSI has a bullish crossover and is above 50.
the candle being made looks very strong.
Supports are at 395.60 (manual) and 368.60 (200 EMA)
If we trust RSI, the candles may show a breakout and my first target would be around 425.
Daily chart of DLF1!
LTP: 406.60
RSI has a bullish crossover and is above 50.
the candle being made looks very strong.
Supports are at 395.60 (manual) and 368.60 (200 EMA)
If we trust RSI, the candles may show a breakout and my first target would be around 425.

免責事項
これらの情報および投稿は、TradingViewが提供または承認する金融、投資、取引、またはその他の種類の助言もしくは推奨であることを意図したものではなく、またこれらに該当するものでもありません。詳細は利用規約をご覧ください。
免責事項
これらの情報および投稿は、TradingViewが提供または承認する金融、投資、取引、またはその他の種類の助言もしくは推奨であることを意図したものではなく、またこれらに該当するものでもありません。詳細は利用規約をご覧ください。