
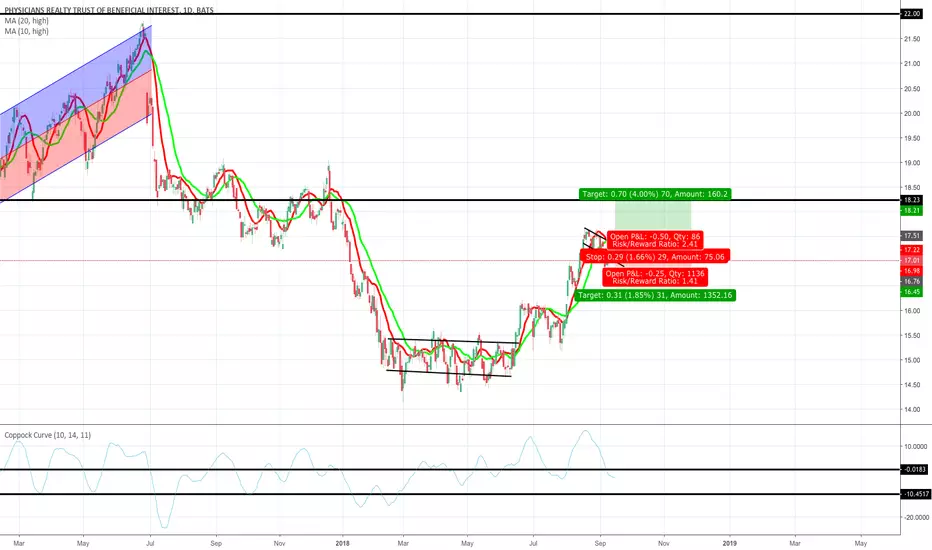
DOC has produced a flag pattern. The 10 and 20 MA are providing resistance. The coppock curve has already gone negative. If the stock breaks the 10 and 20 MA I would buy till resistance (top black line). If the stock forms a candle downwards outside the flag pattern I would short till resistance, but if the coppock curve goes below the lowest black line then I would hold the stock for longer.

免責事項
これらの情報および投稿は、TradingViewが提供または承認する金融、投資、取引、またはその他の種類の助言もしくは推奨であることを意図したものではなく、またこれらに該当するものでもありません。詳細は利用規約をご覧ください。
免責事項
これらの情報および投稿は、TradingViewが提供または承認する金融、投資、取引、またはその他の種類の助言もしくは推奨であることを意図したものではなく、またこれらに該当するものでもありません。詳細は利用規約をご覧ください。