
Hello!
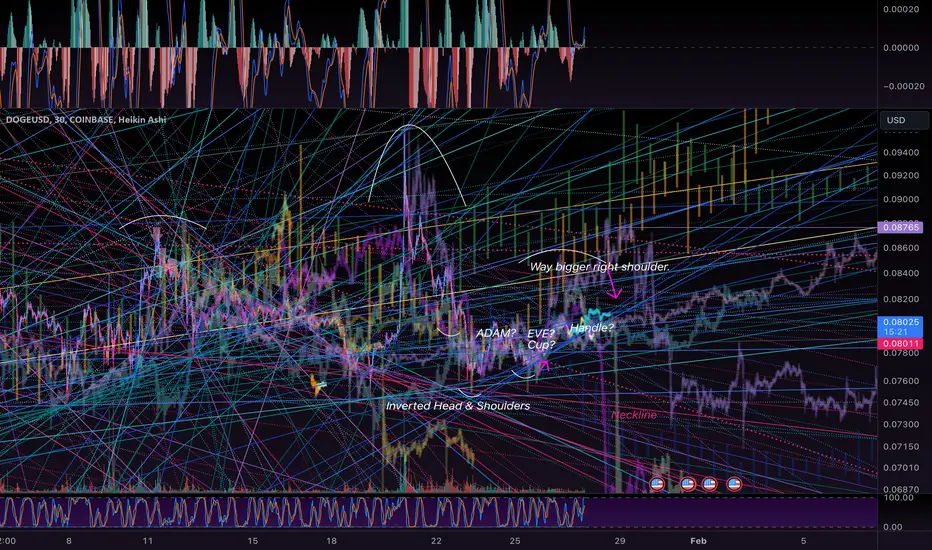
Here are one of the common chart patterns illustrated on my 3D space map. Using some of the short range projections to establish longer range projections makes my chaotic seeming method quite powerful at forecasting the future of likely movements between levels. When key decision points arise, conducting the same method on the 30s time frame allows me to accurately trade. Though that does clutter up the chart and crash the servers at TradingView.
Here we are zoomed in on the 9minute candle.

関連の投稿
免責事項
これらの情報および投稿は、TradingViewが提供または承認する金融、投資、取引、またはその他の種類の助言もしくは推奨であることを意図したものではなく、またこれらに該当するものでもありません。詳細は利用規約をご覧ください。
免責事項
これらの情報および投稿は、TradingViewが提供または承認する金融、投資、取引、またはその他の種類の助言もしくは推奨であることを意図したものではなく、またこれらに該当するものでもありません。詳細は利用規約をご覧ください。