
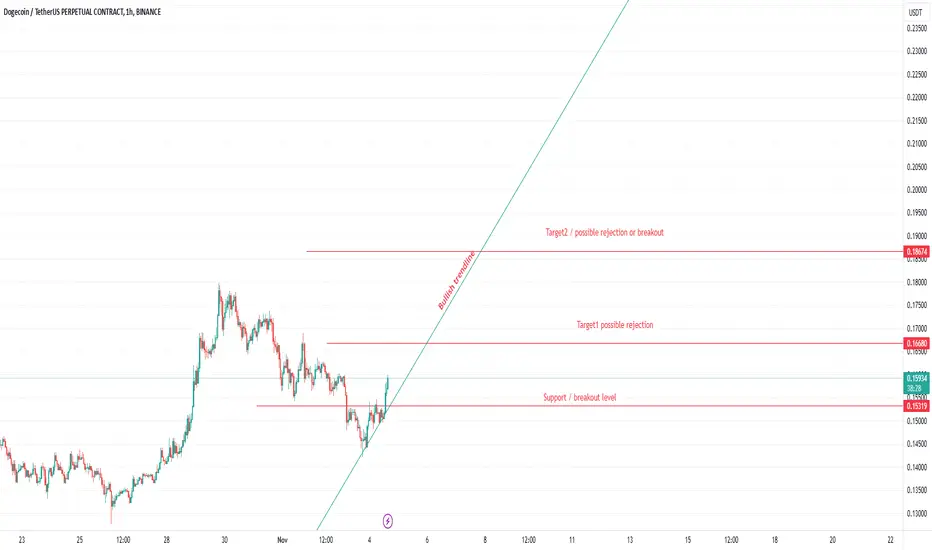
Doge long chart.
The diagonal line is the bullish trend. Each one of the two targets can reject the price to lower values.
When the diagonal line is broken the bullish trend is broken and most of the times the price will go down.
The diagonal line is the bullish trend. Each one of the two targets can reject the price to lower values.
When the diagonal line is broken the bullish trend is broken and most of the times the price will go down.

免責事項
これらの情報および投稿は、TradingViewが提供または承認する金融、投資、取引、またはその他の種類の助言もしくは推奨であることを意図したものではなく、またこれらに該当するものでもありません。詳細は利用規約をご覧ください。
免責事項
これらの情報および投稿は、TradingViewが提供または承認する金融、投資、取引、またはその他の種類の助言もしくは推奨であることを意図したものではなく、またこれらに該当するものでもありません。詳細は利用規約をご覧ください。