
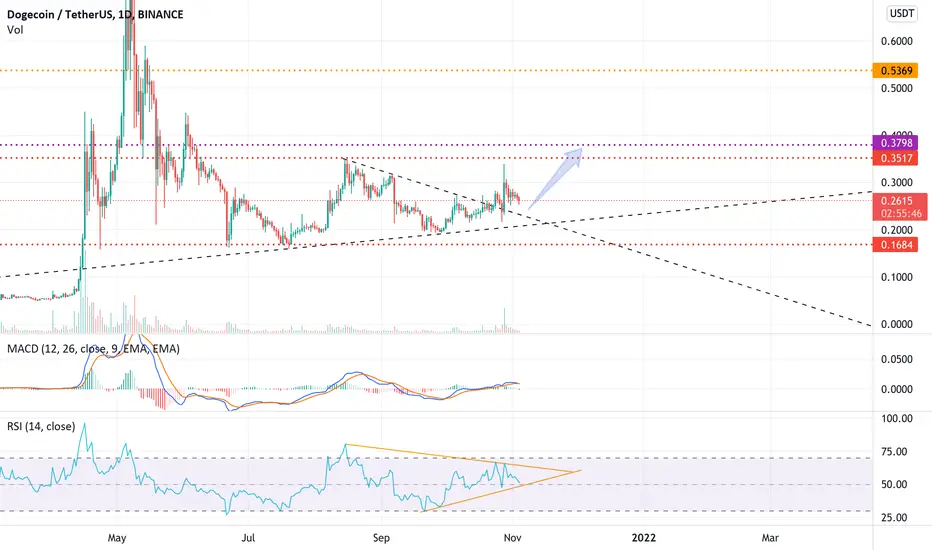
wait until RSI breaks its own down trend line from above, then we can enter a long position.
but, if triangle breaks from bottom, correction is continuing.
Purple line is fibonacci extension Target.🟣
Red lines are support and resistance level.🔴
if you liked it, share it with your friends.
enjoy it.
but, if triangle breaks from bottom, correction is continuing.
Purple line is fibonacci extension Target.🟣
Red lines are support and resistance level.🔴
if you liked it, share it with your friends.
enjoy it.

免責事項
これらの情報および投稿は、TradingViewが提供または承認する金融、投資、取引、またはその他の種類の助言もしくは推奨であることを意図したものではなく、またこれらに該当するものでもありません。詳細は利用規約をご覧ください。
免責事項
これらの情報および投稿は、TradingViewが提供または承認する金融、投資、取引、またはその他の種類の助言もしくは推奨であることを意図したものではなく、またこれらに該当するものでもありません。詳細は利用規約をご覧ください。