
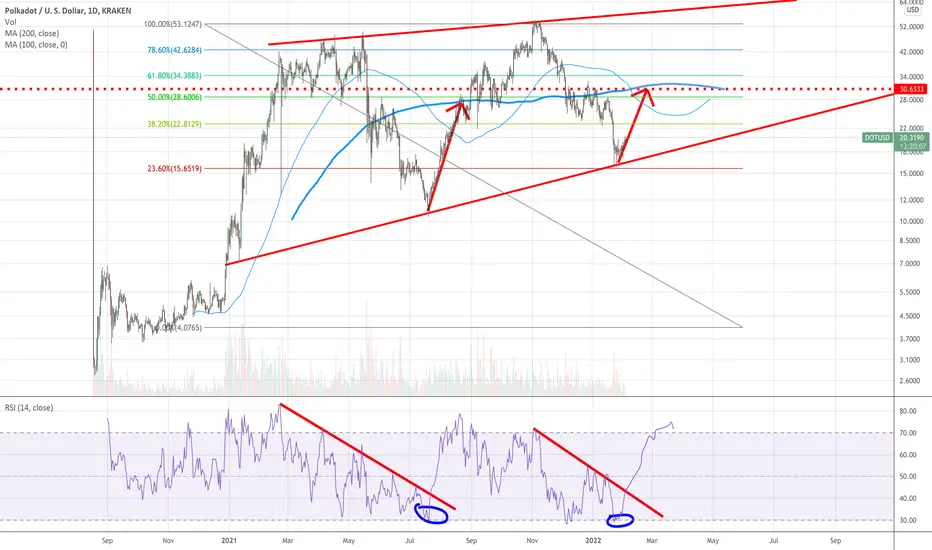
Polkadot forming a long-TF ascending triangle on Daily
2nd bottom & re-test of the ascending triangle seams to be confirmed by:
- RSI bottomed and about to breakout (same levels as mid-july 2021 selloff)
- Current overall market reaction
- 23.6 Fib level acting once again as nice support
- MA 100 & 200 seem to re-create a similar pattern as during mid-july 2021 selloff
Potential 50% gains until EO Feb 2022.
Entry at 19-20$
Stop loss at 17.90$
--> Target 28-31$
Happy Trading!
2nd bottom & re-test of the ascending triangle seams to be confirmed by:
- RSI bottomed and about to breakout (same levels as mid-july 2021 selloff)
- Current overall market reaction
- 23.6 Fib level acting once again as nice support
- MA 100 & 200 seem to re-create a similar pattern as during mid-july 2021 selloff
Potential 50% gains until EO Feb 2022.
Entry at 19-20$
Stop loss at 17.90$
--> Target 28-31$
Happy Trading!
トレード稼働中
Idea Is still Validトレード終了: ストップロスに到達

免責事項
これらの情報および投稿は、TradingViewが提供または承認する金融、投資、取引、またはその他の種類の助言もしくは推奨であることを意図したものではなく、またこれらに該当するものでもありません。詳細は利用規約をご覧ください。
免責事項
これらの情報および投稿は、TradingViewが提供または承認する金融、投資、取引、またはその他の種類の助言もしくは推奨であることを意図したものではなく、またこれらに該当するものでもありません。詳細は利用規約をご覧ください。