
Hello everyone, welcome back.
* This is not a financial advice, trade on your own risk management *
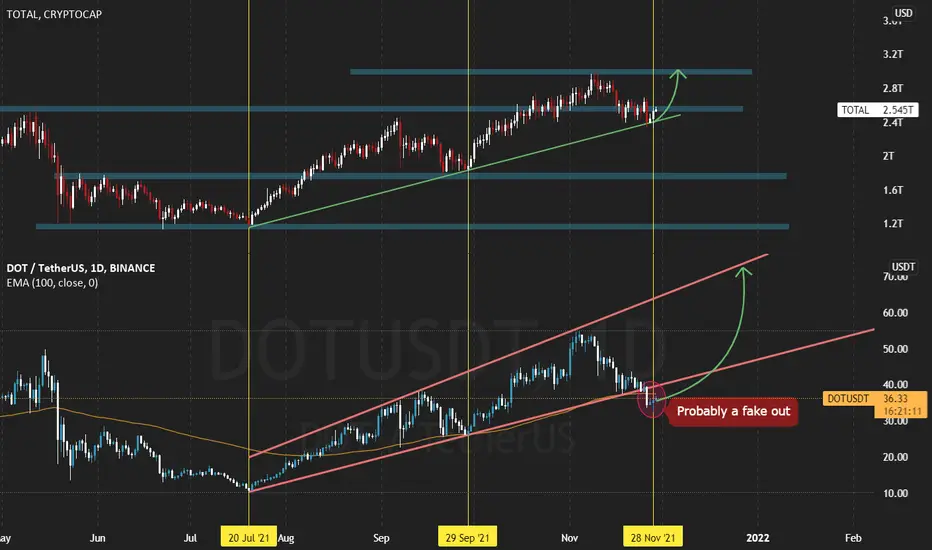
looking at Dot chart, and also analyzing Total market cap with it, we can figure out 2 things :
1. we have a trend line on dot chart in which everytime we hit the bottom, we bounced off and made a new high.
2. every bottom we made on dot, was also made by Total market cap hitting the bottom as well.
no we can see that our trend line is broken in dot, but we can see weakness in the breakout, So I can pretty much tell that its going to be a false breakout ( there is no good momentum candles to confirm this breakout ).
* Tip1 : Every time price fails to break a level, there is a good momentum made on the opposite side run *
So I expect we have a run toward top again, as you can see on the chart, my targets are marked with arrows.
Good luck.
don't forget to like and subscribe.

免責事項
これらの情報および投稿は、TradingViewが提供または承認する金融、投資、取引、またはその他の種類の助言もしくは推奨であることを意図したものではなく、またこれらに該当するものでもありません。詳細は利用規約をご覧ください。
免責事項
これらの情報および投稿は、TradingViewが提供または承認する金融、投資、取引、またはその他の種類の助言もしくは推奨であることを意図したものではなく、またこれらに該当するものでもありません。詳細は利用規約をご覧ください。