
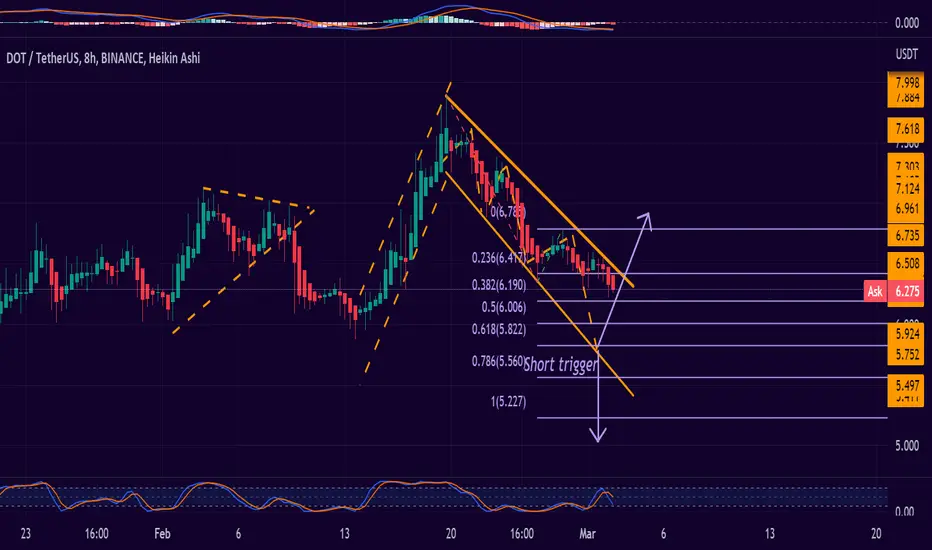
DOTUSDT 8H
The DOT USDT chart in an 8-hour period continues to indicate the bearish channel. It could break the upward channel and leave this bearish trend, but if it drops from the level of 5,833 then we will have a SHORT TRIGGER, that is a trigger for the shorts.
On the M45 chart, we will see the supports and resistances:
DOTUSDT M45:
S1:6,215
S2: 6,145
R1: 6,331
R2: 6,356
The DOT USDT chart in an 8-hour period continues to indicate the bearish channel. It could break the upward channel and leave this bearish trend, but if it drops from the level of 5,833 then we will have a SHORT TRIGGER, that is a trigger for the shorts.
On the M45 chart, we will see the supports and resistances:
DOTUSDT M45:
S1:6,215
S2: 6,145
R1: 6,331
R2: 6,356

Renato Ulianov | Market Analysis & Trading
YouTube: youtube.com/@TradewithRenatoUlianov
Disclaimer: All content is for educational and informational purposes only and does not constitute financial advice.
YouTube: youtube.com/@TradewithRenatoUlianov
Disclaimer: All content is for educational and informational purposes only and does not constitute financial advice.
免責事項
これらの情報および投稿は、TradingViewが提供または承認する金融、投資、取引、またはその他の種類の助言もしくは推奨であることを意図したものではなく、またこれらに該当するものでもありません。詳細は利用規約をご覧ください。
Renato Ulianov | Market Analysis & Trading
YouTube: youtube.com/@TradewithRenatoUlianov
Disclaimer: All content is for educational and informational purposes only and does not constitute financial advice.
YouTube: youtube.com/@TradewithRenatoUlianov
Disclaimer: All content is for educational and informational purposes only and does not constitute financial advice.
免責事項
これらの情報および投稿は、TradingViewが提供または承認する金融、投資、取引、またはその他の種類の助言もしくは推奨であることを意図したものではなく、またこれらに該当するものでもありません。詳細は利用規約をご覧ください。