
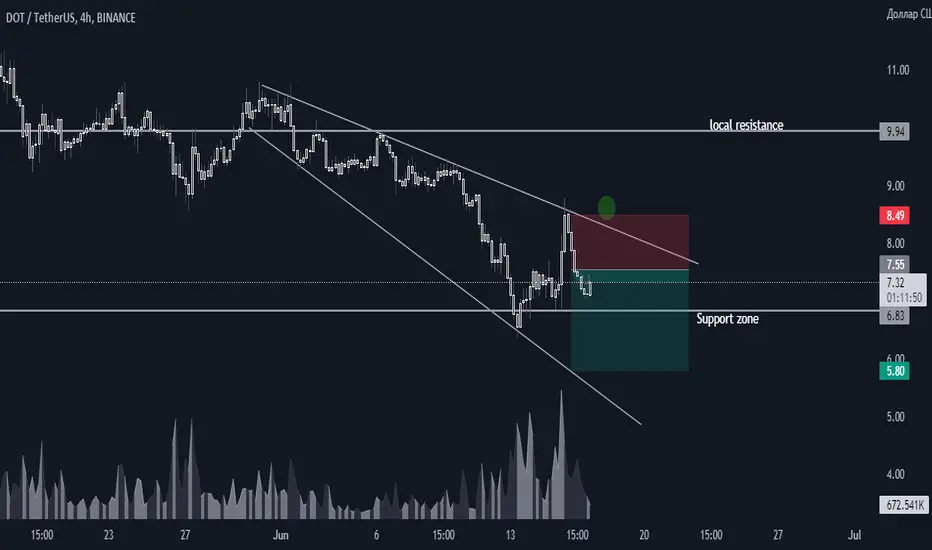
Let's break down polcadot
The price on the chart on the hourly TF 4H shows us a "descending expanding wedge" pattern, at the moment the asset is moving towards the support zone, in case of breakdown, the price will most likely continue to move towards the lower border of the wedge.
Sample plan:
💡Entry point 7.55
🔝Take-profit 6.40
✖️Stop-loss 8.55
✅Don't forget to visit the channel there is a lot of useful information about trading.
✅Write your comments what you think about this coin.

免責事項
これらの情報および投稿は、TradingViewが提供または承認する金融、投資、取引、またはその他の種類の助言もしくは推奨であることを意図したものではなく、またこれらに該当するものでもありません。詳細は利用規約をご覧ください。
免責事項
これらの情報および投稿は、TradingViewが提供または承認する金融、投資、取引、またはその他の種類の助言もしくは推奨であることを意図したものではなく、またこれらに該当するものでもありません。詳細は利用規約をご覧ください。