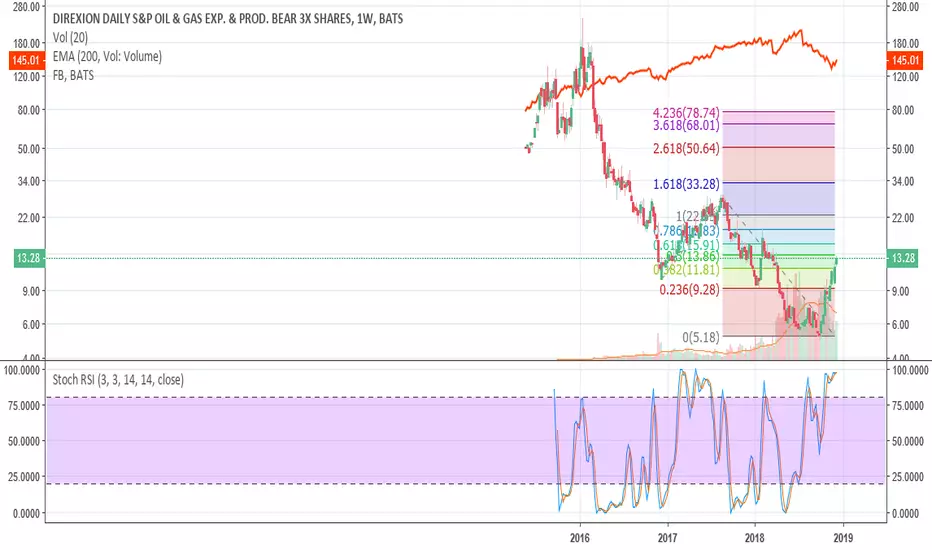
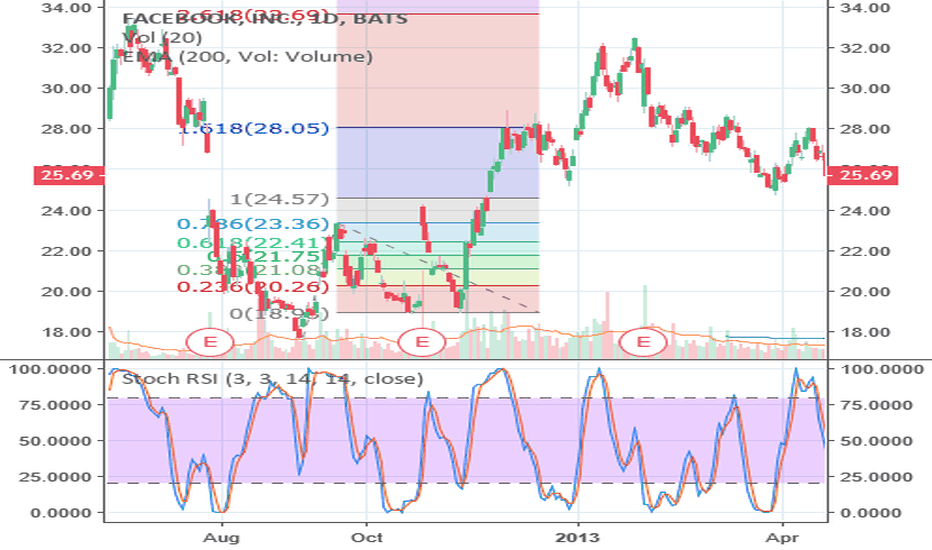
Please see attached similarities between RSI and market movements in early 2013 IPO of Facebook  FB, and early market movements of $DRIP. I see long term weakness in S&P500, till mid 2019 at least. Oil is going lower too.
I can see $30 DRIP by mid-January, and $68 DRIP by March to June. But this could go back to IPO too, but that will take much longer, (5-10 years).
Could be wrong, invest at your own risk. I'm just some guy on the internet.
FB, and early market movements of $DRIP. I see long term weakness in S&P500, till mid 2019 at least. Oil is going lower too.I can see $30
DRIP by mid-January, and $68 DRIP by March to June. But this could go back to IPO too, but that will take much longer, (5-10 years).Could be wrong, invest at your own risk. I'm just some guy on the internet.
トレード稼働中
ノート
Trade still active. Aproaching $16 resistance, possible minor correction here, next target ~$19.トレード稼働中
We are approaching my TP of 19, broke through $16 with a little resistance as expected. I expect the graph to meet great resistance at 19-22 range.ノート
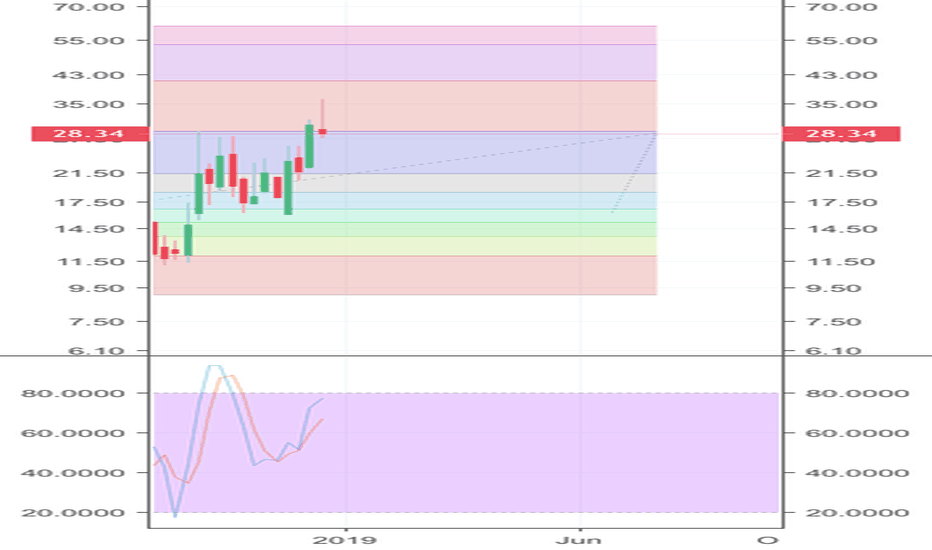
Consolidating for next rise to ~$33 Fibonacci level. We could hit this in the next two weeks, no later than February 1st.Please see my VIX chart for further details:

関連の投稿
免責事項
これらの情報および投稿は、TradingViewが提供または承認する金融、投資、取引、またはその他の種類の助言もしくは推奨であることを意図したものではなく、またこれらに該当するものでもありません。詳細は利用規約をご覧ください。
免責事項
これらの情報および投稿は、TradingViewが提供または承認する金融、投資、取引、またはその他の種類の助言もしくは推奨であることを意図したものではなく、またこれらに該当するものでもありません。詳細は利用規約をご覧ください。