
Hi Traders!
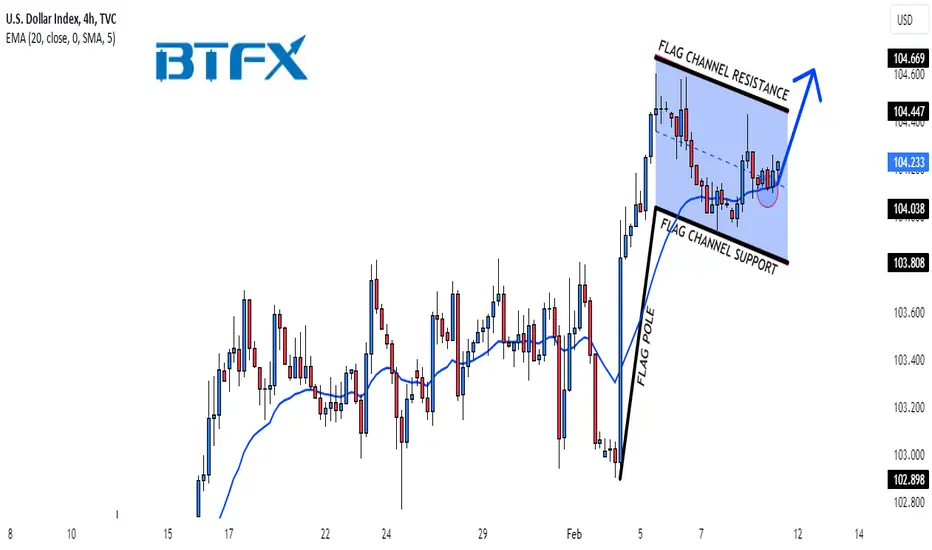
There is a bull flag pattern developed on the DXY 4H chart.
Here are the details:
The price action looks bullish, and the market looks like it is about to complete the consolidation phase in the flag's channel as the flag pattern is in its late stages.
The market is still above the 20 EMA, which is a bullish signal. As long as the market remains above the EMA and flag channel support, our view will remain bullish.
Preferred Direction: Buy
Resistance (FLAG CHANNEL): 104.669
Support (FLAG CHANNEL): 103.808
Technical Indicators: 20 EMA
Please make sure to click on the like/boost button 🚀 as your support greatly helps.
Trade safely and responsibly.
BluetonaFX
There is a bull flag pattern developed on the DXY 4H chart.
Here are the details:
The price action looks bullish, and the market looks like it is about to complete the consolidation phase in the flag's channel as the flag pattern is in its late stages.
The market is still above the 20 EMA, which is a bullish signal. As long as the market remains above the EMA and flag channel support, our view will remain bullish.
Preferred Direction: Buy
Resistance (FLAG CHANNEL): 104.669
Support (FLAG CHANNEL): 103.808
Technical Indicators: 20 EMA
Please make sure to click on the like/boost button 🚀 as your support greatly helps.
Trade safely and responsibly.
BluetonaFX
ノート
Flag complete
免責事項
これらの情報および投稿は、TradingViewが提供または承認する金融、投資、取引、またはその他の種類の助言もしくは推奨であることを意図したものではなく、またこれらに該当するものでもありません。詳細は利用規約をご覧ください。
免責事項
これらの情報および投稿は、TradingViewが提供または承認する金融、投資、取引、またはその他の種類の助言もしくは推奨であることを意図したものではなく、またこれらに該当するものでもありません。詳細は利用規約をご覧ください。