
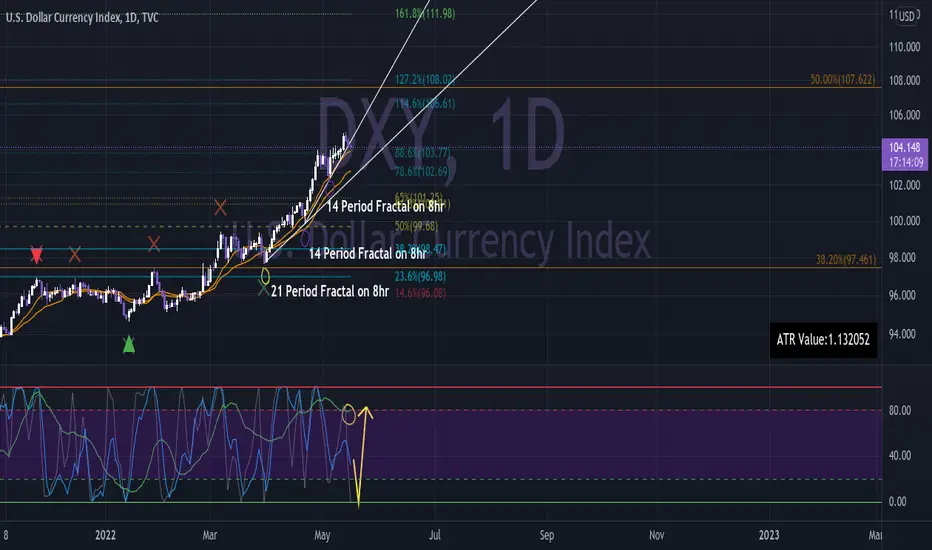
The DXY and Crypto (Total, Total 2, Total 3; whichever you prefer) are inversely correlated. The non price chart indicator shows a k3 bullish divergence meaning that while the other two lines, k1 and k2, are going towards the oversold area; when they reverse to meet the k3 line they will bring more bullish momentum. This is a classic pullback set up.
A Chuvashov Fork was drawn based on fractals from the 8 hour. I see stiff support at the .786 auto fib with a target of the 1.272 auto fib which has confluence with the .5 manual fib.
It will be interesting to see if the FED and other macro powers take advantage of this historical point for the dollar and cause it to rally further which would be max pain for assets.
As far as crypto goes, I am looking for lower points of entry and the blood to continue.
A Chuvashov Fork was drawn based on fractals from the 8 hour. I see stiff support at the .786 auto fib with a target of the 1.272 auto fib which has confluence with the .5 manual fib.
It will be interesting to see if the FED and other macro powers take advantage of this historical point for the dollar and cause it to rally further which would be max pain for assets.
As far as crypto goes, I am looking for lower points of entry and the blood to continue.

免責事項
これらの情報および投稿は、TradingViewが提供または承認する金融、投資、取引、またはその他の種類の助言もしくは推奨であることを意図したものではなく、またこれらに該当するものでもありません。詳細は利用規約をご覧ください。
免責事項
これらの情報および投稿は、TradingViewが提供または承認する金融、投資、取引、またはその他の種類の助言もしくは推奨であることを意図したものではなく、またこれらに該当するものでもありません。詳細は利用規約をご覧ください。