
Pair : DXY Index
Description :
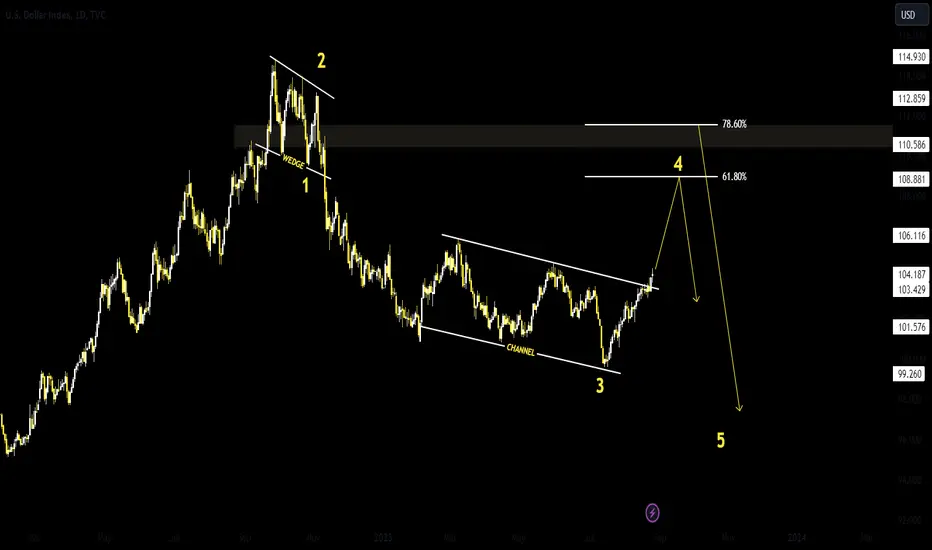
DXY Index is Following Bearish Channel in Short Term Frame and it has Breakout the Upper Trend Line it can Reject from the Previous Strong Resistance ( 104.578 / 104.668 )
And in Long Time Frame it is Following ELLIOT WAVES Theory , according to it will make its " 4th " Corrective Wave at Fibonacci Level " 61.80 / 78.20% )
Description :
DXY Index is Following Bearish Channel in Short Term Frame and it has Breakout the Upper Trend Line it can Reject from the Previous Strong Resistance ( 104.578 / 104.668 )
And in Long Time Frame it is Following ELLIOT WAVES Theory , according to it will make its " 4th " Corrective Wave at Fibonacci Level " 61.80 / 78.20% )

免責事項
これらの情報および投稿は、TradingViewが提供または承認する金融、投資、取引、またはその他の種類の助言もしくは推奨であることを意図したものではなく、またこれらに該当するものでもありません。詳細は利用規約をご覧ください。
免責事項
これらの情報および投稿は、TradingViewが提供または承認する金融、投資、取引、またはその他の種類の助言もしくは推奨であることを意図したものではなく、またこれらに該当するものでもありません。詳細は利用規約をご覧ください。