
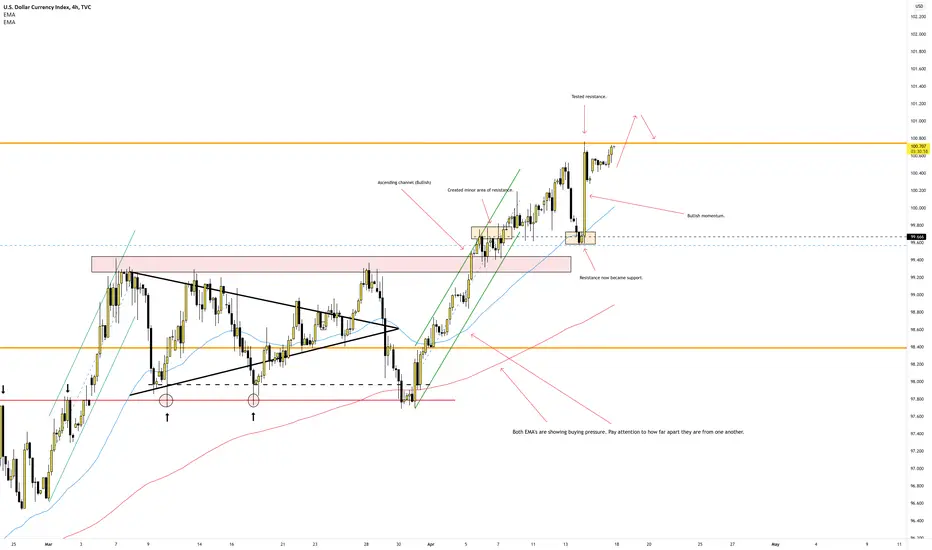
This is a quick breakdown on the DXY (Dollar index) and what I see for start of the trading week. Overall, I see the DXY bullish breaking 100.750 area and doing a simple break/retest on that previous high. You will also notice on the 4H chart that engulfing bullish candlestick that shows that the buyers are not done in this market followed up by the ascending channel that was created prior. Pairs to watch for this week; GBP/USD, USD/JPY, XAU/USD, & EUR/USD.

免責事項
これらの情報および投稿は、TradingViewが提供または承認する金融、投資、取引、またはその他の種類の助言もしくは推奨であることを意図したものではなく、またこれらに該当するものでもありません。詳細は利用規約をご覧ください。
免責事項
これらの情報および投稿は、TradingViewが提供または承認する金融、投資、取引、またはその他の種類の助言もしくは推奨であることを意図したものではなく、またこれらに該当するものでもありません。詳細は利用規約をご覧ください。