
hello
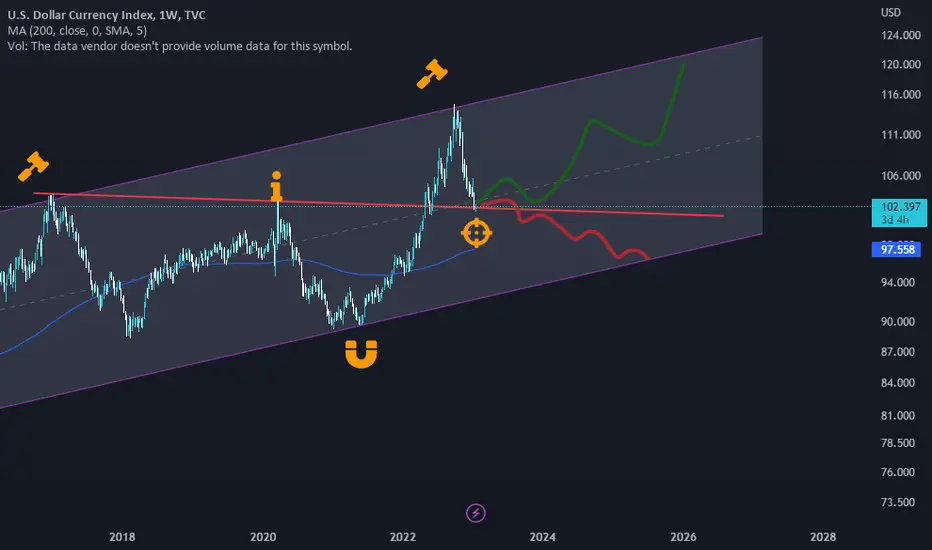
my analyze on DXY chart is a bullish channel
price hit top of channel and then goes down, 1 week ago hitted an Support(Was Resistance before) and react to it, now i can goes top again or break it and then goes to bottom of channel.
also here it is 0.618 Fibo from last bullish wave but price have bearish momentum ,
lets see what will happen and waiting for confirmations.
Hope you enjoy this analyze and like it,
comment your idea about DXY.
Follow for more analyze.
my analyze on DXY chart is a bullish channel
price hit top of channel and then goes down, 1 week ago hitted an Support(Was Resistance before) and react to it, now i can goes top again or break it and then goes to bottom of channel.
also here it is 0.618 Fibo from last bullish wave but price have bearish momentum ,
lets see what will happen and waiting for confirmations.
Hope you enjoy this analyze and like it,
comment your idea about DXY.
Follow for more analyze.

免責事項
これらの情報および投稿は、TradingViewが提供または承認する金融、投資、取引、またはその他の種類の助言もしくは推奨であることを意図したものではなく、またこれらに該当するものでもありません。詳細は利用規約をご覧ください。
免責事項
これらの情報および投稿は、TradingViewが提供または承認する金融、投資、取引、またはその他の種類の助言もしくは推奨であることを意図したものではなく、またこれらに該当するものでもありません。詳細は利用規約をご覧ください。