
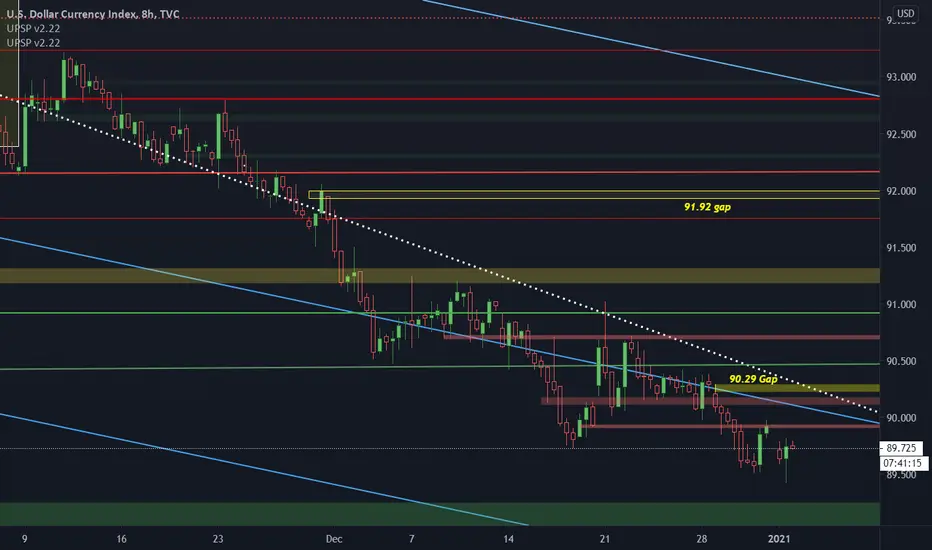
chart explained below .. just a simple dxy chart
ONLY THING NEW i added to these charts are the rectangles
1: the YELLOW boxes are just gaps left by the dxy
2: (greenish / redish box ) are my new custom supply and demand zones
white dotted line connects : mid march - mid may highs .. as shown in previous charts
previous chart :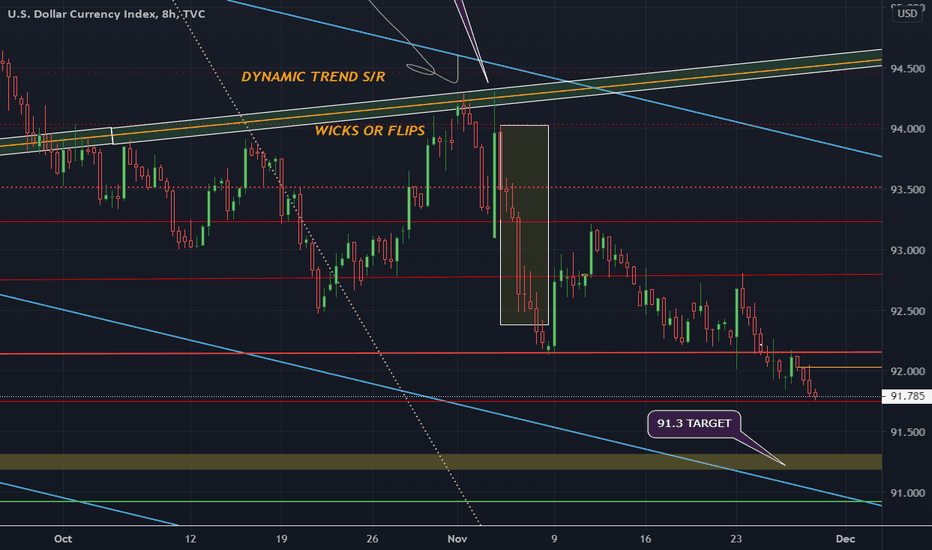
blue lines are cloned trend lines that i've discovered are acting as support/resistance to the trend
green / red lines - horizontal levels to be aware of
ONLY THING NEW i added to these charts are the rectangles
1: the YELLOW boxes are just gaps left by the dxy
2; (greenish / redish box ) are my new custim supply and demand zones
ONLY THING NEW i added to these charts are the rectangles
1: the YELLOW boxes are just gaps left by the dxy
2: (greenish / redish box ) are my new custom supply and demand zones
white dotted line connects : mid march - mid may highs .. as shown in previous charts
previous chart :
blue lines are cloned trend lines that i've discovered are acting as support/resistance to the trend
green / red lines - horizontal levels to be aware of
ONLY THING NEW i added to these charts are the rectangles
1: the YELLOW boxes are just gaps left by the dxy
2; (greenish / redish box ) are my new custim supply and demand zones
ノート
easy zone calls but im posting this to say that yeah the dollar has bounced but not its sitting along last years down trend.. pay attention to the white dotted line from mid-Mrch to mid-May highs ..today we are here ..

免責事項
これらの情報および投稿は、TradingViewが提供または承認する金融、投資、取引、またはその他の種類の助言もしくは推奨であることを意図したものではなく、またこれらに該当するものでもありません。詳細は利用規約をご覧ください。
免責事項
これらの情報および投稿は、TradingViewが提供または承認する金融、投資、取引、またはその他の種類の助言もしくは推奨であることを意図したものではなく、またこれらに該当するものでもありません。詳細は利用規約をご覧ください。