
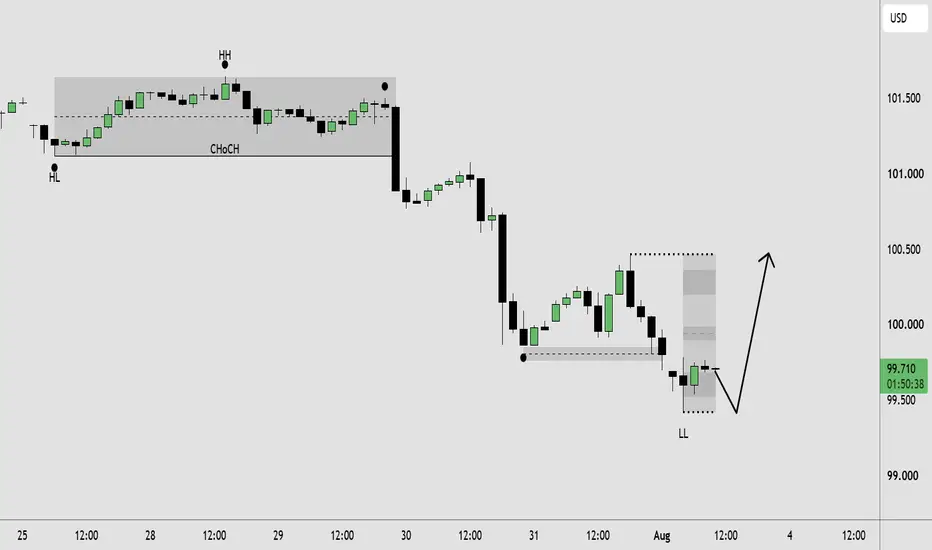
The U.S. Dollar Index (DXY) remains in a short-term bearish trend after breaking below a key market structure level. The chart highlights a Change of Character (CHoCH), followed by a strong impulsive decline that confirmed sellers had taken control. Since the breakdown, price has continued to print lower highs (LH) and lower lows (LL), reinforcing bearish momentum.
The most recent price action shows DXY consolidating near a fresh swing low. This type of consolidation often reflects a temporary pause in momentum rather than a confirmed trend reversal. From a Smart Money Concepts (SMC) perspective, the highlighted zone above current price may represent an area where liquidity and inefficiencies could attract a corrective move before the market establishes its next directional decision.
As long as price remains below the recent swing high and the highlighted supply zone, the overall structure continues to favor sellers. A rejection from this area would maintain the bearish sequence, while a sustained break above it would indicate that market structure is beginning to shift.
The illustrated path on the chart represents one possible price scenario based on current market structure. It is an educational example of how price may react around key technical levels and should not be interpreted as a prediction or guaranteed outcome.
Key Technical Levels
Current Bias: Bearish
Potential Pullback Zone: Highlighted supply/imbalance area
Structure Invalidation: Sustained close above the recent swing high
Support: Recent lower low (LL)
This analysis is based on price action, market structure, liquidity concepts, and Smart Money Concepts (SMC) and is intended for educational purposes only. Always wait for your own confirmation before making trading decisions.
The most recent price action shows DXY consolidating near a fresh swing low. This type of consolidation often reflects a temporary pause in momentum rather than a confirmed trend reversal. From a Smart Money Concepts (SMC) perspective, the highlighted zone above current price may represent an area where liquidity and inefficiencies could attract a corrective move before the market establishes its next directional decision.
As long as price remains below the recent swing high and the highlighted supply zone, the overall structure continues to favor sellers. A rejection from this area would maintain the bearish sequence, while a sustained break above it would indicate that market structure is beginning to shift.
The illustrated path on the chart represents one possible price scenario based on current market structure. It is an educational example of how price may react around key technical levels and should not be interpreted as a prediction or guaranteed outcome.
Key Technical Levels
Current Bias: Bearish
Potential Pullback Zone: Highlighted supply/imbalance area
Structure Invalidation: Sustained close above the recent swing high
Support: Recent lower low (LL)
This analysis is based on price action, market structure, liquidity concepts, and Smart Money Concepts (SMC) and is intended for educational purposes only. Always wait for your own confirmation before making trading decisions.
トレード稼働中

📲 Join Our Telegram Community
t.me/+zoOewsc0ee43ZDc8
t.me/+zoOewsc0ee43ZDc8
関連の投稿
免責事項
これらの情報および投稿は、TradingViewが提供または承認する金融、投資、取引、またはその他の種類の助言もしくは推奨であることを意図したものではなく、またこれらに該当するものでもありません。詳細は利用規約をご覧ください。
📲 Join Our Telegram Community
t.me/+zoOewsc0ee43ZDc8
t.me/+zoOewsc0ee43ZDc8
関連の投稿
免責事項
これらの情報および投稿は、TradingViewが提供または承認する金融、投資、取引、またはその他の種類の助言もしくは推奨であることを意図したものではなく、またこれらに該当するものでもありません。詳細は利用規約をご覧ください。