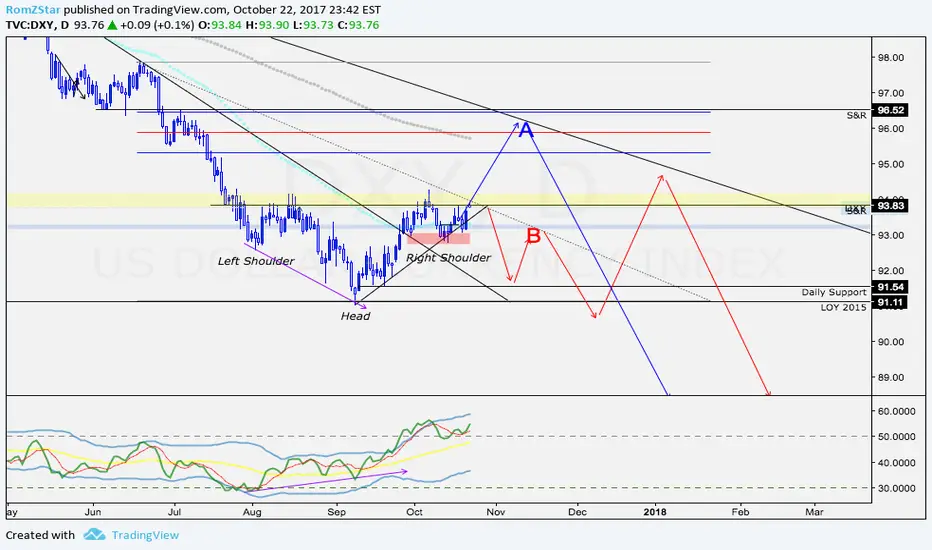
As we were looking for decline on the  DXY, bulls took over control. Here we go with my weekly analysis on the U.S. Dollar Index;
A (orange)(closed) : Price clearly bounced on our bullish trendline. Blue area as been broken in the beginning of the week, my bearish bias was completely canceled. No break and no resistance, this direction bias is now closed.
A (blue) : Previously our plan C, I see theDXY showing some significant strength signs;
Blue area as been broken which was our resistance. Next area to watch for a break through is the yellow one.
Price bounced on the bullish trendline.
A nice reverse head and shoulder is forming, looking for a break of the neckline.
Price found support right at the retest level after the trend line breakout, red area.
Support found on both 50(aqua) and 200(gray) exponential moving averages after a bullish crossover.
A nice regular bullish divergence also indicates a nice trend reversal, highlighted by the purple arrows on data and indicator window.
Target is 96.00, optimal trade entry area for shorting.
B (red) : Fake bullish move to the yellow area and by dropping back resulting as a price ranging.
Only price action can determine those bias, even none of them could occur.
Bias as changed for now but still bearish overall, I am currently looking for bullish move on this index, driving all USD based pairs.
Dollar strengh = USDXXX UP / XXXUSD DOWN
Dollar weak = XXXUSD UP / USDXXX DOWN
DXY, bulls took over control. Here we go with my weekly analysis on the U.S. Dollar Index;A (orange)(closed) : Price clearly bounced on our bullish trendline. Blue area as been broken in the beginning of the week, my bearish bias was completely canceled. No break and no resistance, this direction bias is now closed.
A (blue) : Previously our plan C, I see the
DXY showing some significant strength signs;Blue area as been broken which was our resistance. Next area to watch for a break through is the yellow one.
Price bounced on the bullish trendline.
A nice reverse head and shoulder is forming, looking for a break of the neckline.
Price found support right at the retest level after the trend line breakout, red area.
Support found on both 50(aqua) and 200(gray) exponential moving averages after a bullish crossover.
A nice regular bullish divergence also indicates a nice trend reversal, highlighted by the purple arrows on data and indicator window.
Target is 96.00, optimal trade entry area for shorting.
B (red) : Fake bullish move to the yellow area and by dropping back resulting as a price ranging.
Only price action can determine those bias, even none of them could occur.
Bias as changed for now but still bearish overall, I am currently looking for bullish move on this index, driving all USD based pairs.
Dollar strengh = USDXXX UP / XXXUSD DOWN
Dollar weak = XXXUSD UP / USDXXX DOWN

関連の投稿
免責事項
これらの情報および投稿は、TradingViewが提供または承認する金融、投資、取引、またはその他の種類の助言もしくは推奨であることを意図したものではなく、またこれらに該当するものでもありません。詳細は利用規約をご覧ください。
免責事項
これらの情報および投稿は、TradingViewが提供または承認する金融、投資、取引、またはその他の種類の助言もしくは推奨であることを意図したものではなく、またこれらに該当するものでもありません。詳細は利用規約をご覧ください。