
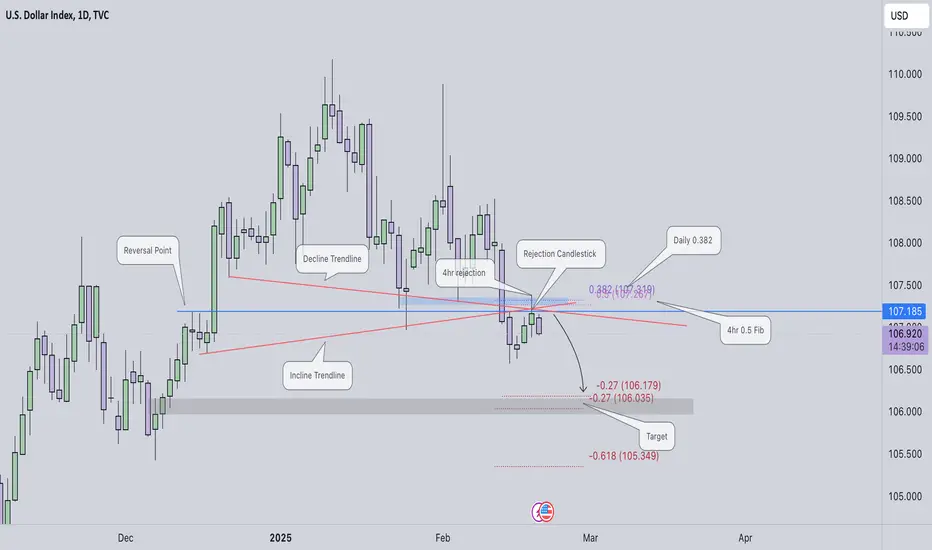
The US Dollar Index (DXY) is currently indicating the likely direction after closing below 106.965. I anticipate a move back to the 107.200-250 range before continuing its bearish swing. Several confluences support this, including the reversal point, an ascending trendline, a descending trendline, a rejection candlestick, the daily 0.382 Fibonacci level, the 4-hour 0.5 Fibonacci level, and a 4-hour order block. My target for the DXY is 106.083. As for gold, it has reached a new all-time high of 2954.944. I expect a pullback before it heads higher, potentially towards the 3000 level.
4hr DXY Chart

1hr DXY Chart

30m Gold Chart

4hr DXY Chart
1hr DXY Chart
30m Gold Chart

免責事項
これらの情報および投稿は、TradingViewが提供または承認する金融、投資、取引、またはその他の種類の助言もしくは推奨であることを意図したものではなく、またこれらに該当するものでもありません。詳細は利用規約をご覧ください。
免責事項
これらの情報および投稿は、TradingViewが提供または承認する金融、投資、取引、またはその他の種類の助言もしくは推奨であることを意図したものではなく、またこれらに該当するものでもありません。詳細は利用規約をご覧ください。