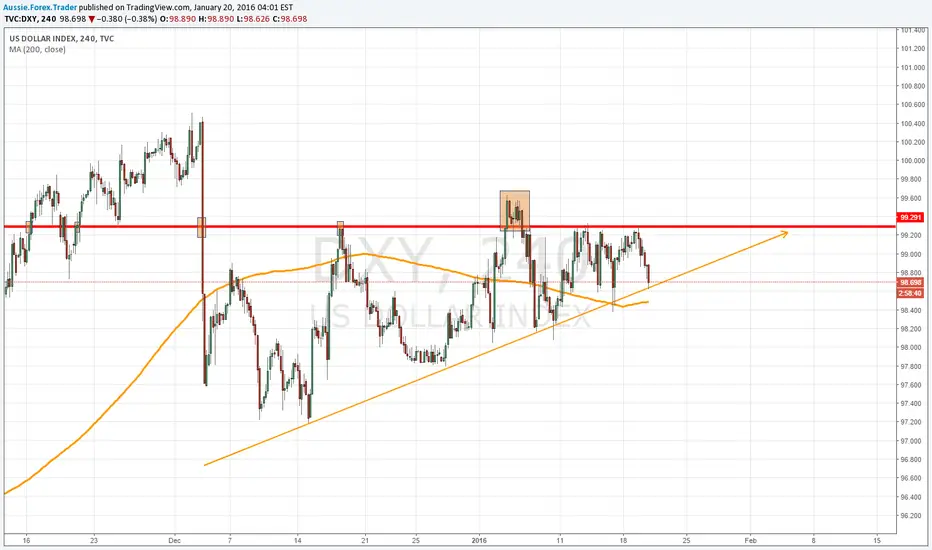
This is more of a thought, than a trading idea...
There is a rising wedge, of which is about to complete, on DXY.
DXY.
This is a bearish pattern, and if I'm correct, its full formation may coincide with the latest USD data that is due to be released on Thursday.
There is a rising wedge, of which is about to complete, on
DXY. This is a bearish pattern, and if I'm correct, its full formation may coincide with the latest USD data that is due to be released on Thursday.
ノート
This wasn't the best example or a rising wedge, it's more like a rising triangle (yes, I see price on 05/01/16 broke 99.27). However, what this chart does tell us is that something huge is about to happen. USD will either smash its way up, or resume its downtrend.
免責事項
これらの情報および投稿は、TradingViewが提供または承認する金融、投資、取引、またはその他の種類の助言もしくは推奨であることを意図したものではなく、またこれらに該当するものでもありません。詳細は利用規約をご覧ください。
免責事項
これらの情報および投稿は、TradingViewが提供または承認する金融、投資、取引、またはその他の種類の助言もしくは推奨であることを意図したものではなく、またこれらに該当するものでもありません。詳細は利用規約をご覧ください。