
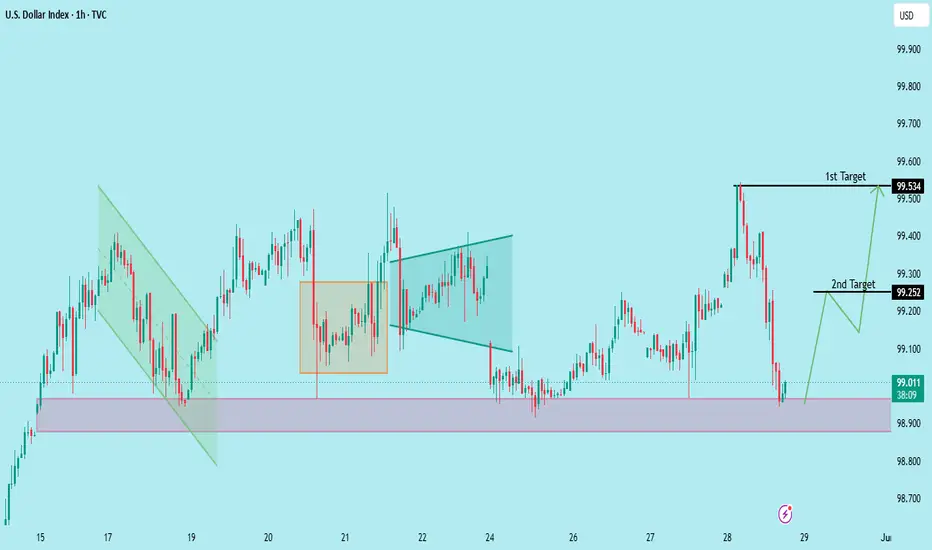
The U.S. Dollar Index (DXY) is reacting strongly from a major support zone around 98.90 after a sharp intraday decline. Price action suggests buyers are stepping in near demand, increasing the probability of a bullish rebound.
The chart highlights a potential recovery move toward the first resistance at **99.534**, followed by a continuation toward the second target near **99.252** after a possible short-term pullback. Holding above the highlighted support area will remain crucial for maintaining bullish momentum.
**1st Target:** 99.534
**2nd Target:** 99.252
トレード稼働中
Active トレード終了: 利益確定目標に到達
1st target achieved 
関連の投稿
免責事項
これらの情報および投稿は、TradingViewが提供または承認する金融、投資、取引、またはその他の種類の助言もしくは推奨であることを意図したものではなく、またこれらに該当するものでもありません。詳細は利用規約をご覧ください。
関連の投稿
免責事項
これらの情報および投稿は、TradingViewが提供または承認する金融、投資、取引、またはその他の種類の助言もしくは推奨であることを意図したものではなく、またこれらに該当するものでもありません。詳細は利用規約をご覧ください。