
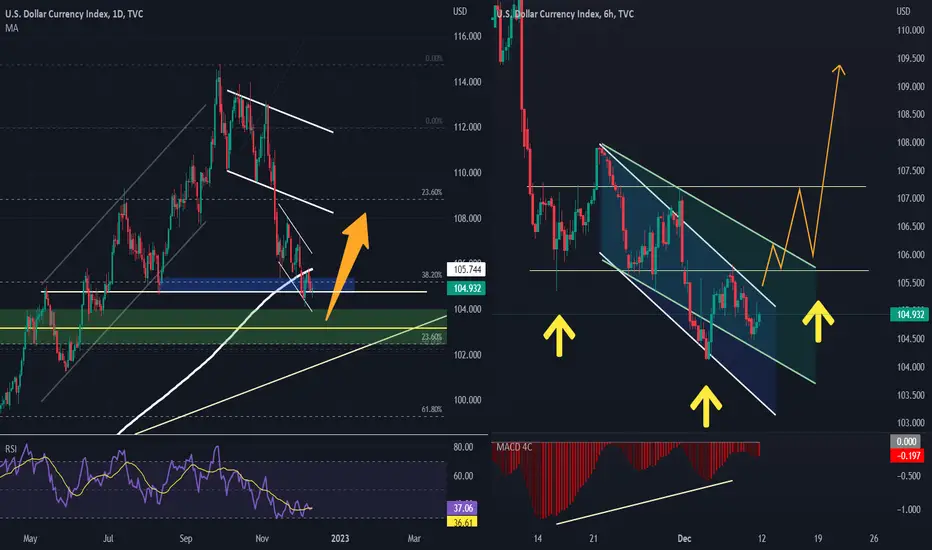
On the daily chart, The DXY holds in a powerful resistance zone; there is a 200DMA, monthly resistance, weekly resistance, and a supply zone with a 38.20 Fib.
In the 6-hour time frame, we have two reversal patterns, with a divergence in the MACD.
We may see a head and shoulders pattern if a candle closes above 105.74, as shown by the yellow arrows on the hourly chart.
--------------------------------
Feel free to share your thoughts in the comments, and kindly support the idea with a like. Your support is greatly appreciated!
In the 6-hour time frame, we have two reversal patterns, with a divergence in the MACD.
We may see a head and shoulders pattern if a candle closes above 105.74, as shown by the yellow arrows on the hourly chart.
--------------------------------
Feel free to share your thoughts in the comments, and kindly support the idea with a like. Your support is greatly appreciated!

関連の投稿
免責事項
これらの情報および投稿は、TradingViewが提供または承認する金融、投資、取引、またはその他の種類の助言もしくは推奨であることを意図したものではなく、またこれらに該当するものでもありません。詳細は利用規約をご覧ください。
免責事項
これらの情報および投稿は、TradingViewが提供または承認する金融、投資、取引、またはその他の種類の助言もしくは推奨であることを意図したものではなく、またこれらに該当するものでもありません。詳細は利用規約をご覧ください。