
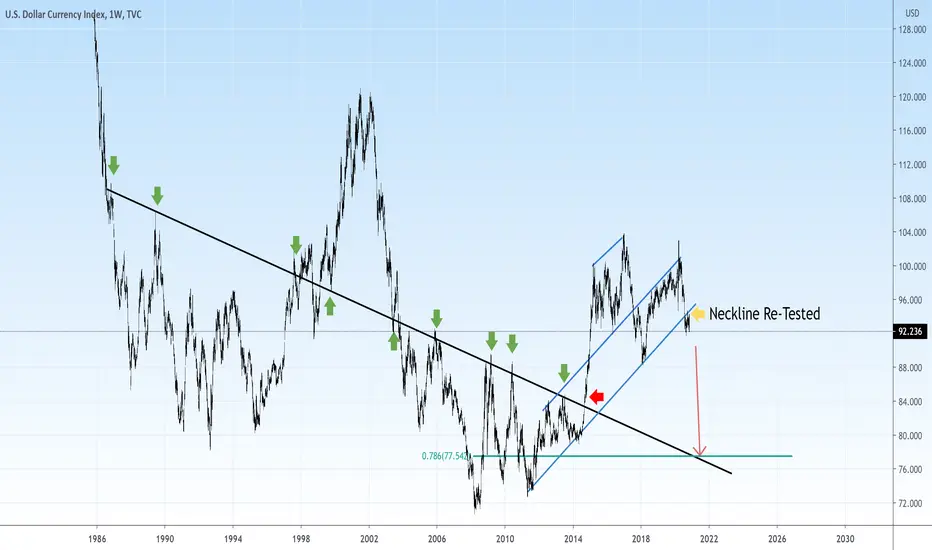
Chart shows the possibility of the Head And Shoulders Pattern on the weekly chart and the target.
Chart also shows the highly dynamic support line which was broken and not re-tested in 2014 and could be the target before any reversal in the trend.
Head and Shoulders marks the bear market and the neckline has already been broken and re-tested.
In my opinion, the Dollar will now be losing power very quickly.
You can see potential EUR / USD and GBP / USD targets at the links below.
Chart also shows the highly dynamic support line which was broken and not re-tested in 2014 and could be the target before any reversal in the trend.
Head and Shoulders marks the bear market and the neckline has already been broken and re-tested.
In my opinion, the Dollar will now be losing power very quickly.
You can see potential EUR / USD and GBP / USD targets at the links below.

関連の投稿
免責事項
これらの情報および投稿は、TradingViewが提供または承認する金融、投資、取引、またはその他の種類の助言もしくは推奨であることを意図したものではなく、またこれらに該当するものでもありません。詳細は利用規約をご覧ください。
免責事項
これらの情報および投稿は、TradingViewが提供または承認する金融、投資、取引、またはその他の種類の助言もしくは推奨であることを意図したものではなく、またこれらに該当するものでもありません。詳細は利用規約をご覧ください。