
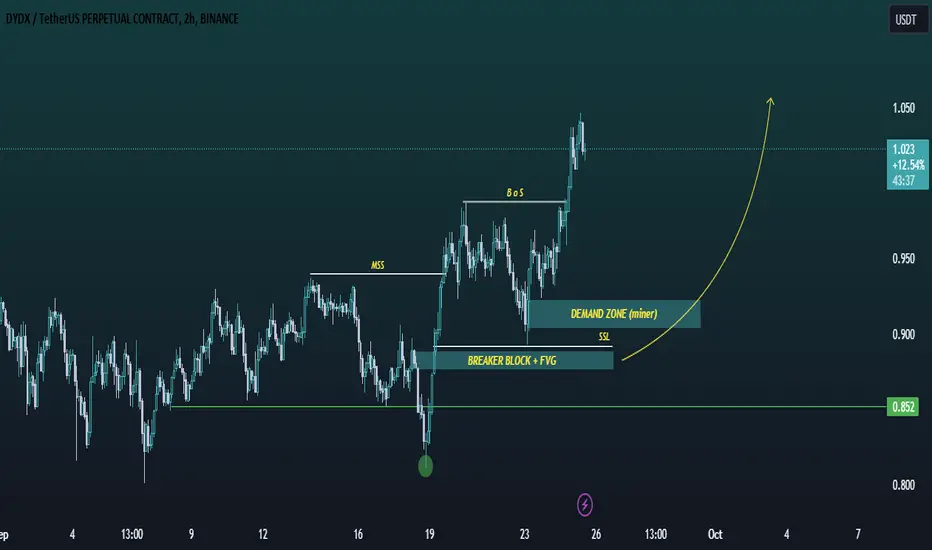
DYDX/USDT shifted its structure into bullish after MSS (marked on the chart). It continued its bullish move and did BOS (also marked on the chart). Price can not go straight up. As we are in bullish trend so we have to look for long oppertunities. By the way I have marked two long areas on the chart. First one is miner demand zone and second is a good swing long oppertunity with DCA of green horizental line.

免責事項
これらの情報および投稿は、TradingViewが提供または承認する金融、投資、取引、またはその他の種類の助言もしくは推奨であることを意図したものではなく、またこれらに該当するものでもありません。詳細は利用規約をご覧ください。
免責事項
これらの情報および投稿は、TradingViewが提供または承認する金融、投資、取引、またはその他の種類の助言もしくは推奨であることを意図したものではなく、またこれらに該当するものでもありません。詳細は利用規約をご覧ください。