
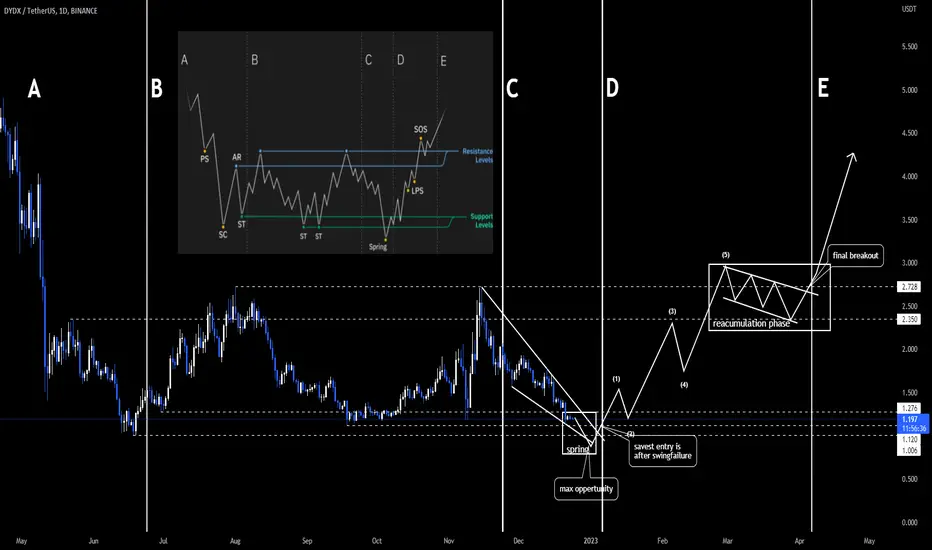
Wyckoff accumulation scheme
We will update this idea with more charts with comparable accumulation fractals.
In this chart we are in a high potential spring phase, wich also can be defined as ''MAX OPPURTINTY'' wich is usual the final move down before strong increase in price.
How to made a trade/investment plan out of it?
1) If u are a longterm investor and u belief in an asset/company/etc, then i might want to set a buy ladder (multiple limit buy orders) below previous low(s). The risk on this strategie is that nobody knows excactly how low it can go.
2) Wait for a stong sellof below previous lows and wait for sings of reversal '' bullish div, high negative fundingrates at extreme oversold levels, fair, fud, etc. You get the point, waiting for confluence that the market might reverse after a strong selloff.
3) Wait for conformation on a swingfailure ( Bullish breakout on the downsloping trendline) This is not the best entry, but its the savest entry out of the 3.
4) Combine the 3 above with the amount u are willing to invest based on the risk u want to take.
We will update this chart with historical charts where we have seen the same kind of accumulation phases.
Regards,
Team Quantistic
We will update this idea with more charts with comparable accumulation fractals.
In this chart we are in a high potential spring phase, wich also can be defined as ''MAX OPPURTINTY'' wich is usual the final move down before strong increase in price.
How to made a trade/investment plan out of it?
1) If u are a longterm investor and u belief in an asset/company/etc, then i might want to set a buy ladder (multiple limit buy orders) below previous low(s). The risk on this strategie is that nobody knows excactly how low it can go.
2) Wait for a stong sellof below previous lows and wait for sings of reversal '' bullish div, high negative fundingrates at extreme oversold levels, fair, fud, etc. You get the point, waiting for confluence that the market might reverse after a strong selloff.
3) Wait for conformation on a swingfailure ( Bullish breakout on the downsloping trendline) This is not the best entry, but its the savest entry out of the 3.
4) Combine the 3 above with the amount u are willing to invest based on the risk u want to take.
We will update this chart with historical charts where we have seen the same kind of accumulation phases.
Regards,
Team Quantistic
ノート
ノート
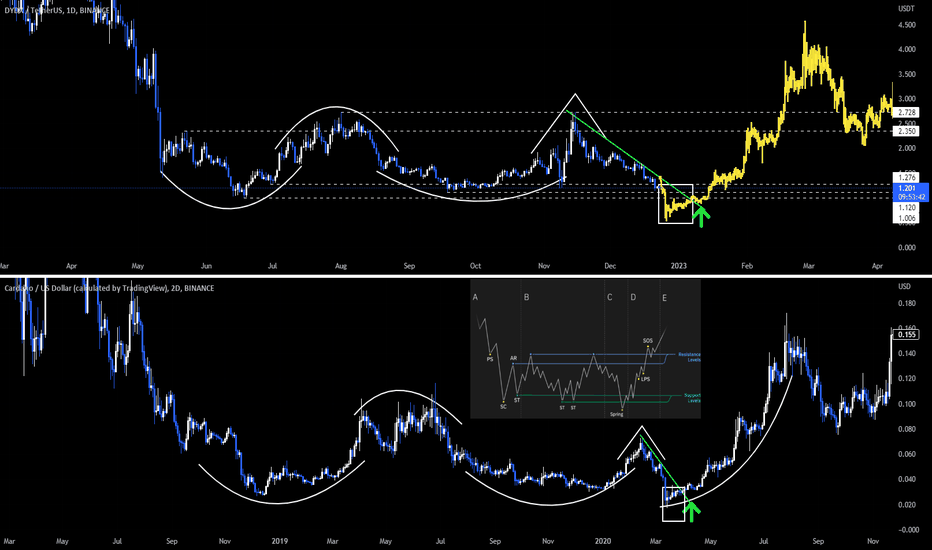
ノート
If the daily will close like this, we have a swingfailure on DYDX. (down swing is high likely over)ノート
Low timeframe scenario DYDX
ノート
short scalp setup on DYDX before spot long. 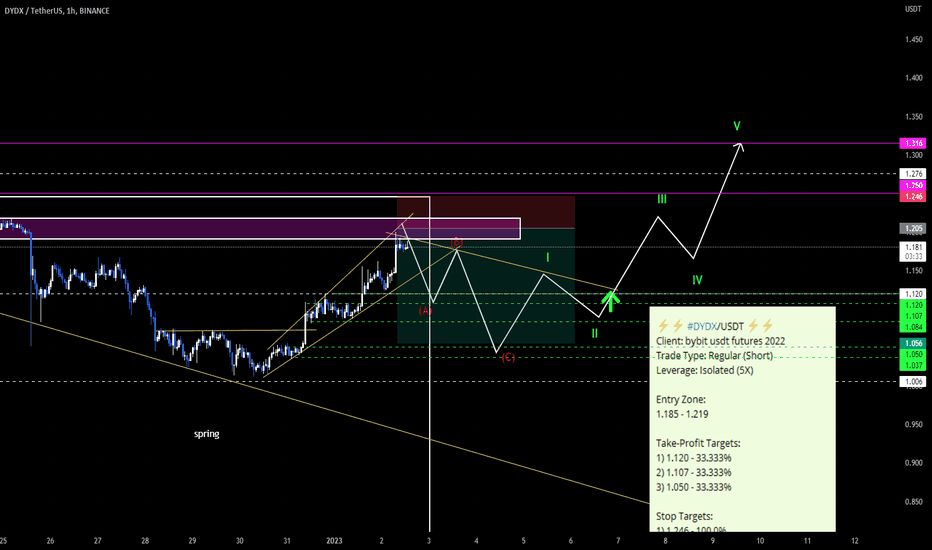

関連の投稿
免責事項
これらの情報および投稿は、TradingViewが提供または承認する金融、投資、取引、またはその他の種類の助言もしくは推奨であることを意図したものではなく、またこれらに該当するものでもありません。詳細は利用規約をご覧ください。
免責事項
これらの情報および投稿は、TradingViewが提供または承認する金融、投資、取引、またはその他の種類の助言もしくは推奨であることを意図したものではなく、またこれらに該当するものでもありません。詳細は利用規約をご覧ください。