
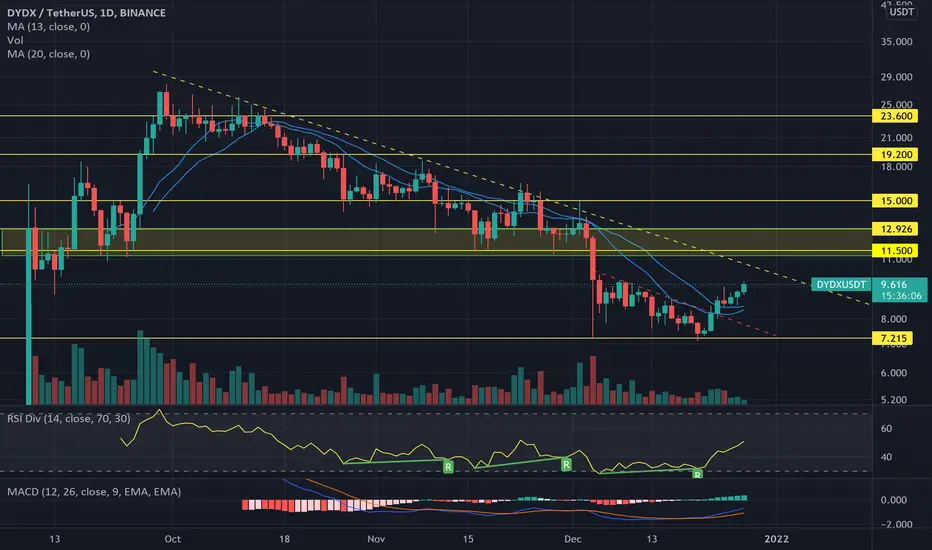
DYDX seems to bottom out. It closed bullish in weekly chart after 11 weeks. It closed bullish on daily chart as well and even made a break from the smaller falling wedge (red dotted line). The price is now trading above 13 and 20 MA and closing the gap to larger falling wedge – break above would trigger very bullish move (yellow dotted line). DYDX has lots of potential on the upside. My targets; TP1 $11.5, TP2 $15, TP3 19.2, TP4 $23.6; SL under 7.1 - small chance.

免責事項
これらの情報および投稿は、TradingViewが提供または承認する金融、投資、取引、またはその他の種類の助言もしくは推奨であることを意図したものではなく、またこれらに該当するものでもありません。詳細は利用規約をご覧ください。
免責事項
これらの情報および投稿は、TradingViewが提供または承認する金融、投資、取引、またはその他の種類の助言もしくは推奨であることを意図したものではなく、またこれらに該当するものでもありません。詳細は利用規約をご覧ください。