ロング
EBSTBTC - Symmetrical Triangle.
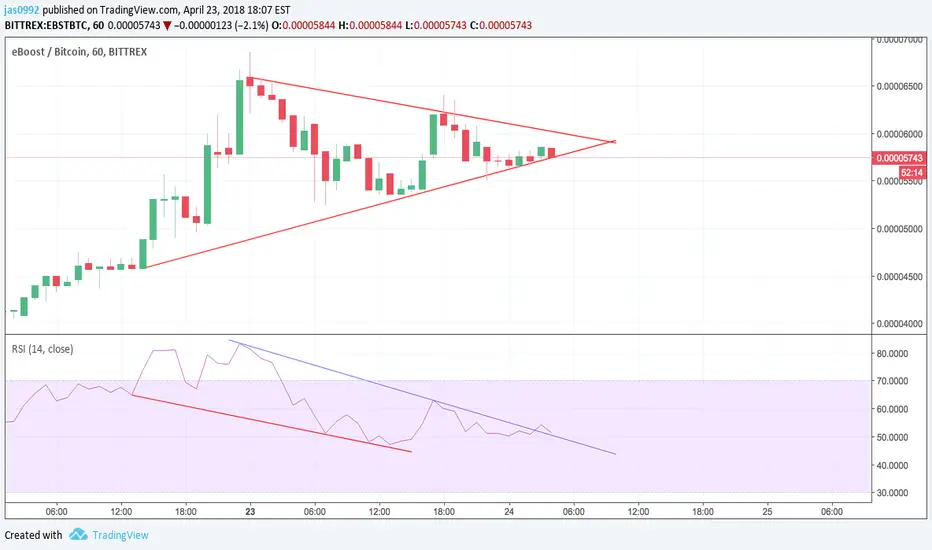
Symmetrical triangle being formed on 1H EBSTBTC triangle, which is a continuation pattern 75% of the time. There is also hidden divergence on the RSI oscillator (depicted with red trendline). Also, RSI seems to be breaking out of the downtrend line (depicted with blue trendline). EBST is looking bullish to me. However, we must wait for the price to break out of the pattern before entering a trade. Keeping a close eye on this, I would enter once the price breaks out of the triangle.
I am guessing the price would be around 0.00006100-0.00006200 when entry signal will be given. Based on that, my stop-loss would be 0.00005000 and target would be 0.00007500.
Constructive criticism is welcomed.
I am guessing the price would be around 0.00006100-0.00006200 when entry signal will be given. Based on that, my stop-loss would be 0.00005000 and target would be 0.00007500.
Constructive criticism is welcomed.
注文をキャンセル
Symmetrical triangle broke to the wrong side. Trade not taken.
免責事項
これらの情報および投稿は、TradingViewが提供または承認する金融、投資、取引、またはその他の種類の助言もしくは推奨であることを意図したものではなく、またこれらに該当するものでもありません。詳細は利用規約をご覧ください。
免責事項
これらの情報および投稿は、TradingViewが提供または承認する金融、投資、取引、またはその他の種類の助言もしくは推奨であることを意図したものではなく、またこれらに該当するものでもありません。詳細は利用規約をご覧ください。