
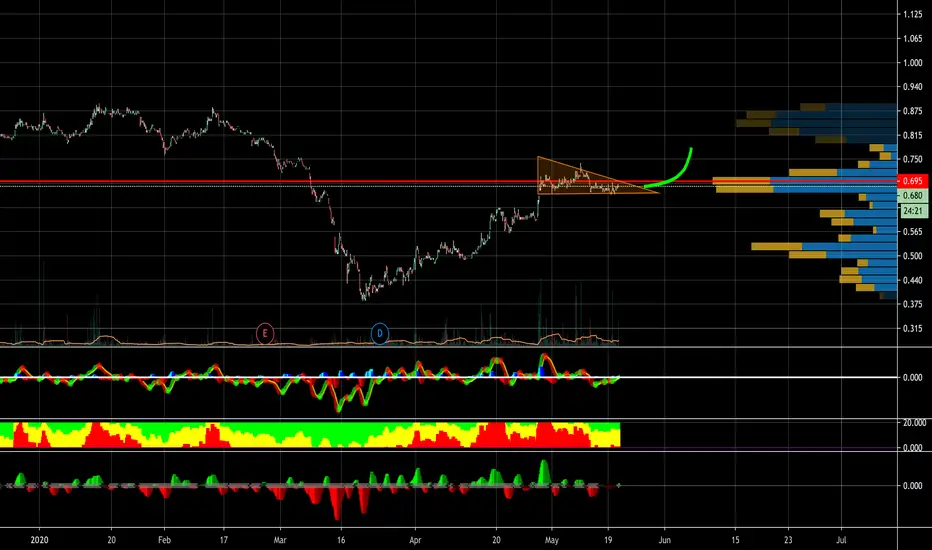
A bullish flag pattern appeared, as we can see on the chart.
First TP : 0.74 (previous resistant point)
If price break 0.74 with high volume,
Second TP : 0.8.
First support : 0.66
second support : 0.62
Can cut loss at either 1st or 2nd support level.
No buy or sell call was given. Buy at own risk :)
First TP : 0.74 (previous resistant point)
If price break 0.74 with high volume,
Second TP : 0.8.
First support : 0.66
second support : 0.62
Can cut loss at either 1st or 2nd support level.
No buy or sell call was given. Buy at own risk :)

免責事項
これらの情報および投稿は、TradingViewが提供または承認する金融、投資、取引、またはその他の種類の助言もしくは推奨であることを意図したものではなく、またこれらに該当するものでもありません。詳細は利用規約をご覧ください。
免責事項
これらの情報および投稿は、TradingViewが提供または承認する金融、投資、取引、またはその他の種類の助言もしくは推奨であることを意図したものではなく、またこれらに該当するものでもありません。詳細は利用規約をご覧ください。