ロング
EOS weekly chart good buy zone
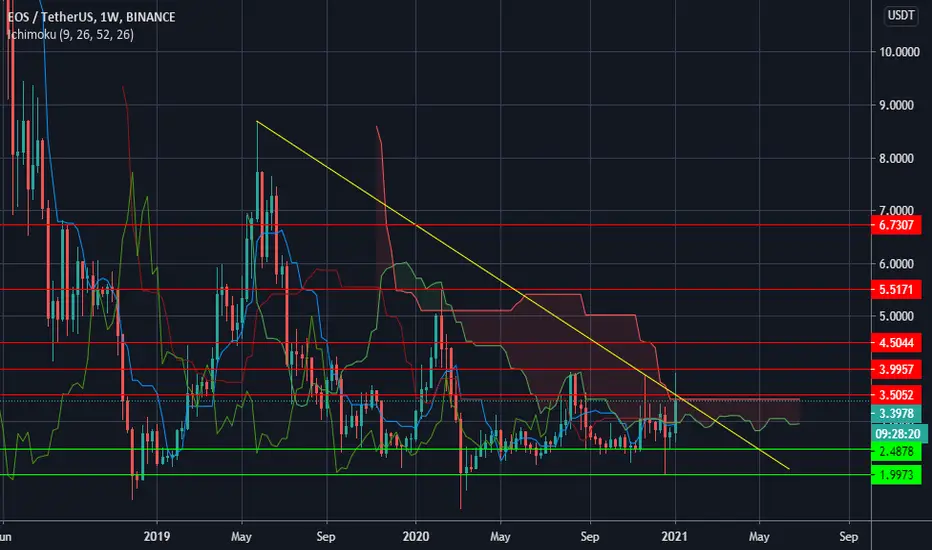
hi my friend as u can see in the weekly chart finally the trend broken but we still don't have confirmation yet .... so if you are risky person wait after full break and enter if not you can buy some in you bag ... im sure after this we have bullrun for eos
the static line are for weekly time frame u can use daily or 4h chart to get entry
the static line are for weekly time frame u can use daily or 4h chart to get entry
トレード稼働中
buy above the ichi cloud or in dip 2.5 for long termトレード終了: 利益確定目標に到達
all target almost done wait for update
関連の投稿
免責事項
これらの情報および投稿は、TradingViewが提供または承認する金融、投資、取引、またはその他の種類の助言もしくは推奨であることを意図したものではなく、またこれらに該当するものでもありません。詳細は利用規約をご覧ください。
免責事項
これらの情報および投稿は、TradingViewが提供または承認する金融、投資、取引、またはその他の種類の助言もしくは推奨であることを意図したものではなく、またこれらに該当するものでもありません。詳細は利用規約をご覧ください。