
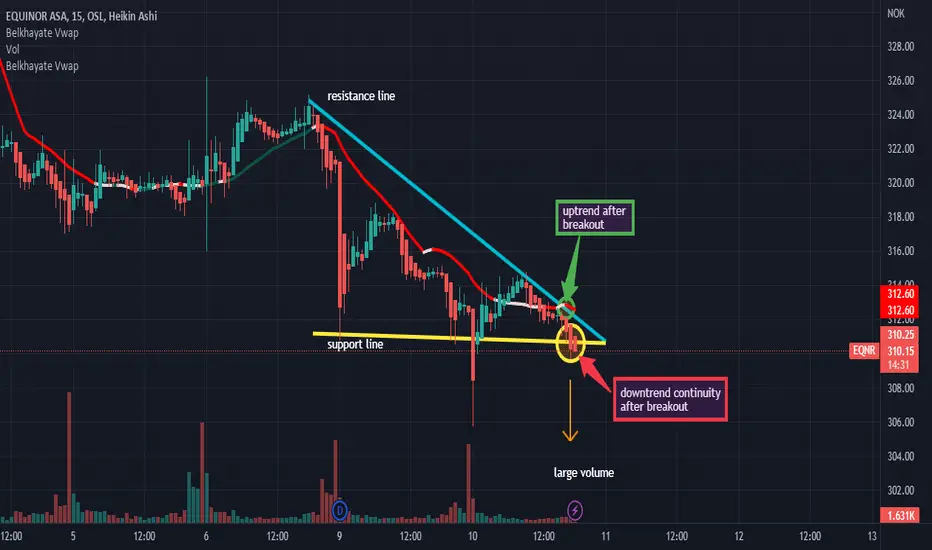
As you see on the chart we are in a downtrend so we will have a big probability of downtrend continuty after the breakout with force the support line by a big red candle with a large red volume. But, in other hand we could have a reversal trend (uptrend) after the breakout with force the vwap indicator and the resistance line by a big green candle with a large green volume. Thanks.

免責事項
これらの情報および投稿は、TradingViewが提供または承認する金融、投資、取引、またはその他の種類の助言もしくは推奨であることを意図したものではなく、またこれらに該当するものでもありません。詳細は利用規約をご覧ください。
免責事項
これらの情報および投稿は、TradingViewが提供または承認する金融、投資、取引、またはその他の種類の助言もしくは推奨であることを意図したものではなく、またこれらに該当するものでもありません。詳細は利用規約をご覧ください。