
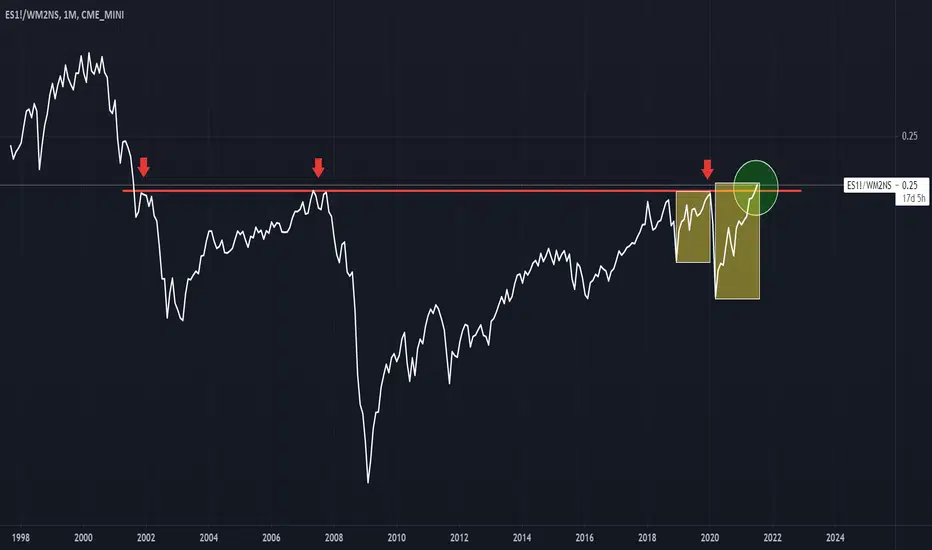
We're either seeing a breakout here on the S&P500 Futures/M2 chart, or this resistance level, which has held up since 2001, is about to spoil the bulls party. Look at the last impulse wave toward the resistance line in yellow. We're stretched, but we're seeing the same pattern, folks. Trade accordingly...

関連の投稿
免責事項
これらの情報および投稿は、TradingViewが提供または承認する金融、投資、取引、またはその他の種類の助言もしくは推奨であることを意図したものではなく、またこれらに該当するものでもありません。詳細は利用規約をご覧ください。
関連の投稿
免責事項
これらの情報および投稿は、TradingViewが提供または承認する金融、投資、取引、またはその他の種類の助言もしくは推奨であることを意図したものではなく、またこれらに該当するものでもありません。詳細は利用規約をご覧ください。